
by Ray Frazier
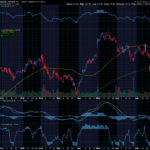
Below is a chart of AOL (America Online). The chart shows a great indicator to use in determining exit points for your options positions (and stock positions). I have plotted two indicators. The first is the 21 bar exponential moving average and is used to show when a stock goes bullish or bearish in the short term. However, it is not used to determine an exit strategy. The second indicator is a 21 bar exponential linear regression line, the straight dark line running through the stock price bars. I use this indicator to determine my exit point for my options positions. As you can see, the stock crossed the regression line and closed below it on April 7, 1999. The following trade day, the stock fell around $15 and powered back to close just under the regression line. From there the stock could not get above the regression line.

My strategy in using this indicator is very simple and very reliable. If, near the close of the trade day, the stock price is below the regression line but is not more than 2% below the regression line, we hold the position. If the stock crosses the “2% below the regression line” rule, in the last half hour of the trade day, it’s best to take your profits. The stock may be heading lower in price in the near future. In volatile markets selling of stocks is quite common, but as the trade day goes on, often times the stocks will recover.
Probably the most important times in the trade day are the first hour after the opening bell and the last hour before the closing bell. These are the times that we can make determinations as to the direction of the markets and individual stocks for the day and the following day. The first hour of trading will often set the direction, whether it is up or down, for the major indexes. The chosen direction of these indexes affects the direction of stocks for the majority of the day. The last hour, and especially the last half hour, of the trading day will usually set the tone for the following trade day. Investors will be able to evaluate whether or not the stock price will be able to stay above the “2% regression line” rule.

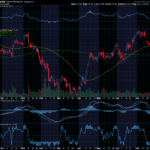
Below is another chart of AOL, demonstrating what happened to the stock after crossing below the “2% regression line”. As you can see, after crossing through the 2% regression line, the stock suffered a huge sell-off and rallied back up. However, the stock was unable to cross into bullish territory and continued to sell off for several months. At the time this was written, AOL was at the $88 level and continued to suffer. Notice that the shorter moving average (darker line) of the MACD indicator crossed the longer moving average (lighter line) above one week after the stock crossed through the 2% regression line rule. Also, in the bottom section of the chart, you can see that our Time Segmented Volume indicator shows that negative volume (sellers) started to “rule” the stock when it crossed its moving average about a week after our exit point.

So, the lesson here is to listen to the rules that you lay out for yourself when you have an options position in play. I believe that the “2% regression line” rule is an invaluable addition to any guidelines you are already using in your trading, and should be included in the top three you trade by. It may be the best exit strategy available to investors and could prove invaluable.


Recent Comments