
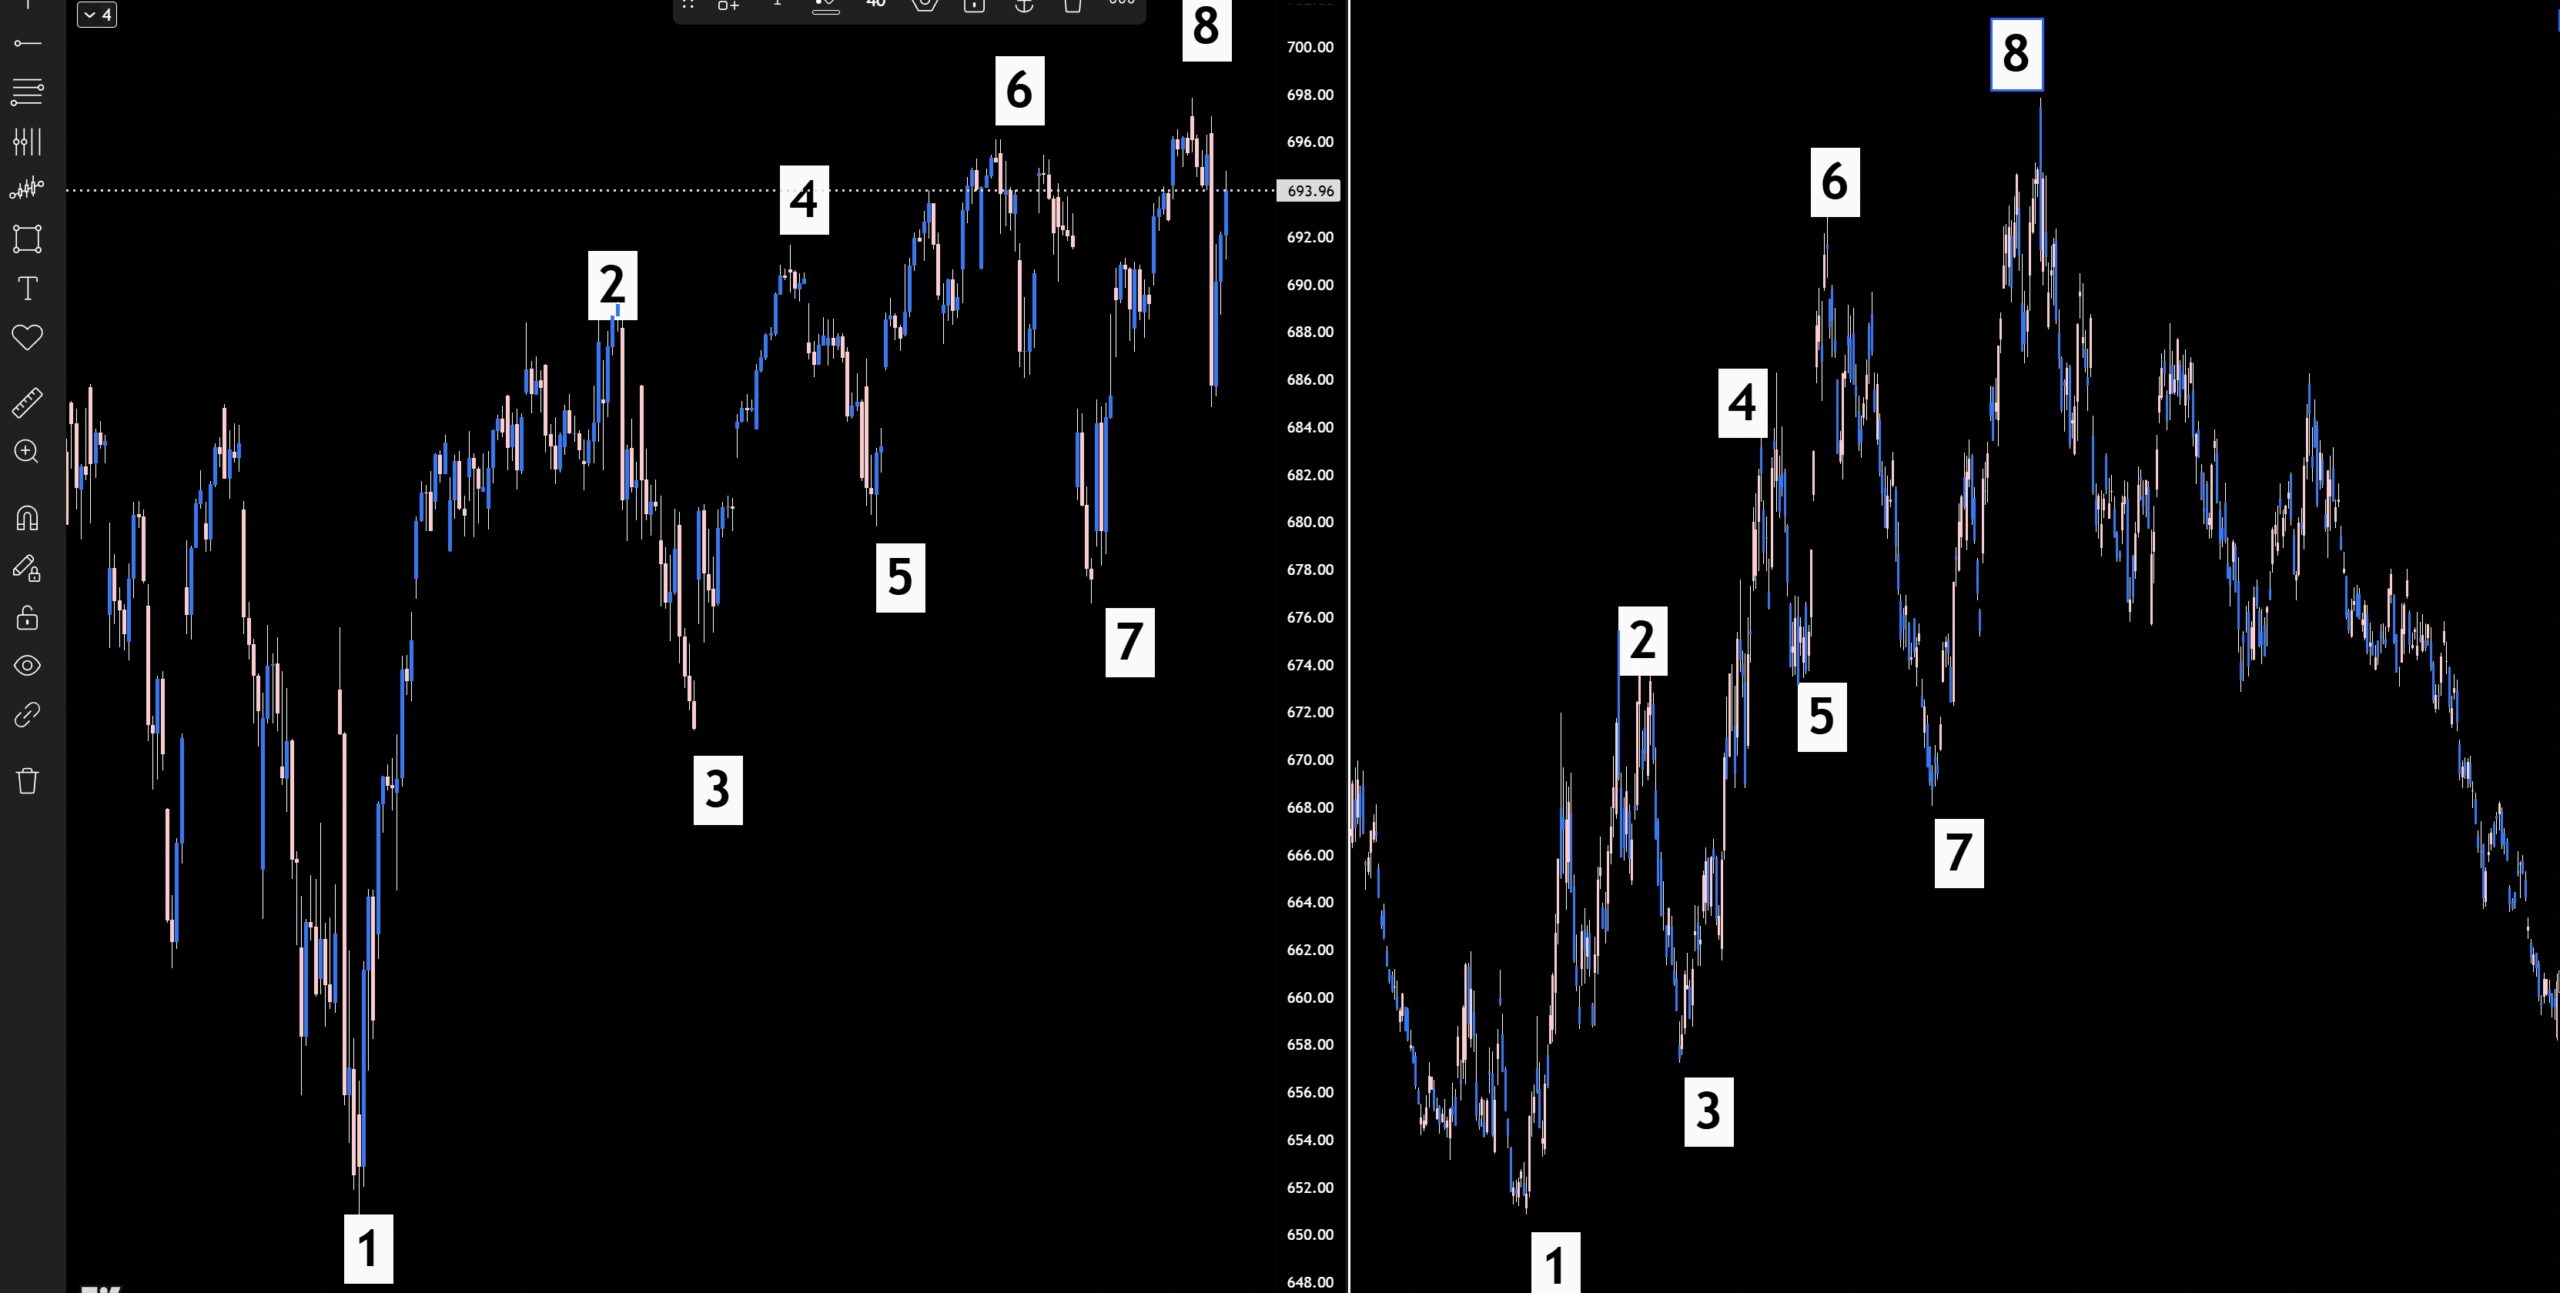
The chart on the left is the current SPY daily chart. The chart on the right is a possible “fractal” forecast. What it means is if the pattern holds lower prices are ahead for the SPY.
Thanks,
Joe
PS-Recently I opened up a new program that I have been working on for the past few years. At a key point, I tweaked the formula and this thing has been absolutely on fire. If you want to see the trades it is kicking out, click here.


Recent Comments