
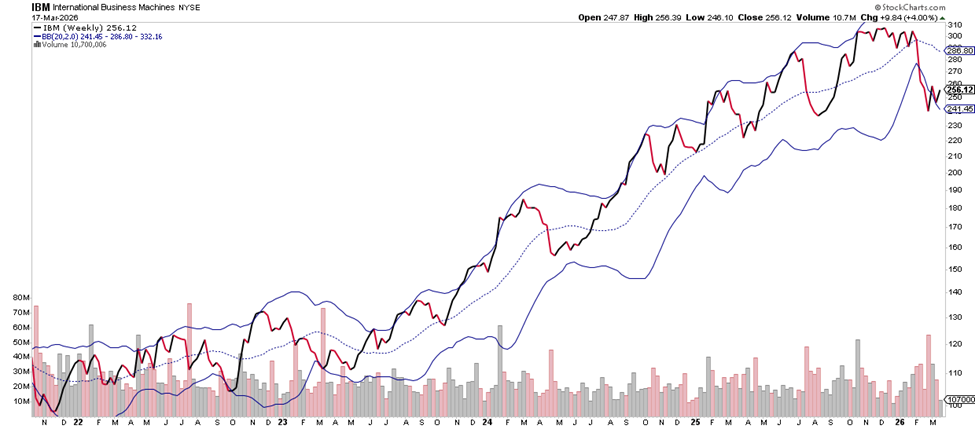
International Business Machines (IBM) has been in a strong uptrend, consistently riding the upper half of its Bollinger Bands, which is a classic sign of sustained bullish momentum. Recently, however, price pulled back sharply from the upper band and briefly pushed toward the lower band, signaling an expansion in volatility after an extended move higher.
URGENT UPDATE–I have had a wave of emails come in asking for my insight on the best way to harness the explosive volatility of this current market. It has been overwhelming. The good news is there is a tool that is turning this wild market into wins and I am going to do a live demo with John Boyer on Monday, March 23rd at 1pm ET. If you want to see the new DNA Indicator in action and even get some of the trades it is spotting now, grab you seat here. It will fill up quickly so don’t wait. It is absolutely crushing it in this whipsaw climate.
This kind of move from the upper band toward the lower band often represents a reset in price rather than an immediate trend change. Notably, price has begun to rebound back toward the middle band (the 20-period moving average), which now becomes a key level. Holding above and reclaiming the middle band would suggest the uptrend remains intact.
Traders will be watching to see if price can move back toward the upper band, which would indicate momentum is reasserting itself, while failure to hold the middle band could open the door for a deeper consolidation.
Wishing you the best,
Wendy


Recent Comments