
by Wendy Kirkland
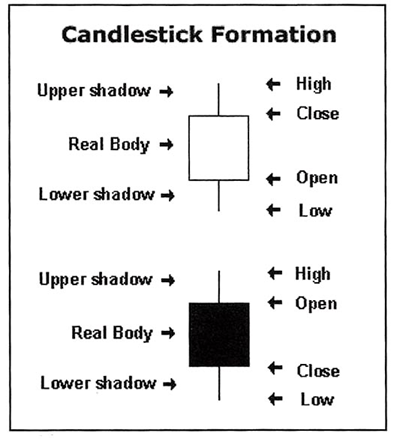
As a trader, you will need to have an understanding of the candlestick, or candle, which is an important technical symbol on charts in general. They are designed to tell a concise story. You will see candles in red, black, and hollow.
Candlesticks provide information about the average price of the underlying equity. They reflect the price action over the course of the market sessions for the time period selected (in our case daily). If it is a daily chart, the candle reflects the movement that day from opening to closing bell. If the chart is a weekly chart, then the candle reflects an accumulation of the week’s activity throughout that week.
When looking at your chart, the last candlestick (below) can be a partial if you are viewing it before the closing bell or day’s end. If you looked at the last candle on a daily chart and it was noon, the candle would reflect the first two and a half hours of the trading day. If the last candle was on a weekly chart and it was Tuesday at market close, the candle would reflect the activity for Monday and Tuesday. These candles, too, are usually two colors, often red and black and are either solid or hollow (unfilled).
Thin lines above and below the body of the candle represent the high/low range of the session, and are called shadows, or sometimes are referred to as “wicks” and “tails”. How the price movement unfolded for the time period or the relationship between the opening and closing price is vital information and forms the essence of candlestick symbols.
Hollow candlesticks, where the close price is greater than the open price, indicate buying took place. Filled candlesticks, where the close price is less than the open price (usually red), indicates a period of selling.
Candlestick’s color and position on the chart reflect: whether the price closed higher or lower than the price at the opening of the day, and where it closed in comparison to the previous periods.
Generally speaking, the longer the body of the candlestick, the more intense the buying and selling was that took place during that time period. On the other hand, short candlestick bodies indicate little price movement and represents consolidation (tight price range).
As you look below at the candlestick on the left, first note where the solid candle opened and closed in relation to the high and low of the period. What does that relationship tell you?
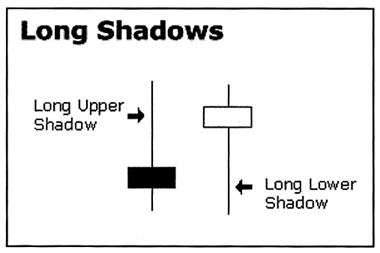
This relationship indicates there was a great deal of (bullish) positive buying interest, which was barely overcome by the (bears) downward momentum selling. How do you know this? Look how far the stock price went up after the market opened (represented by the topmost shadow or wick). Also note how little the downside was by comparison. Even though this reflects a down day for this stock (the candled opened higher than it closed), the size of the candle’s body, shoes little selling (bearish) strength.
Conversely, hollow candlesticks with long lower shadows and short upper shadows or wicks indicate that sellers dominated during the sessions and drove prices lower. However, buyers later rallied to push prices higher by the end of the session, and the strong close into positive territory created a long lower shadow.
In addition, the shape and size of the candle tells you a great deal more.
You can imagine that a candlestick depicts a football game between the buyers (Bulls) and the sellers (Bears). The bottom of the candlestick (the session’s low) represents the bears goal-line and the top is the bulls goal-line.
The harder the bears push to close to the low, the nearer they are to a touchdown. The harder the bulls push the close to the high, the nearer they are to a touchdown. The various sizes of the candlesticks indicate who controlled the ball for most of the game period.
Now consider the candlesticks in the figure below. What can you infer? Who ruled the day?
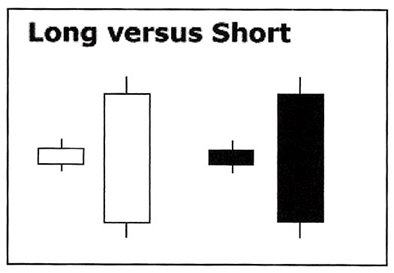
In the hollow candles to the left, the Bulls buying was very strong, with very little selling. Long hollow candles with “shortish” shadows (as shown here) show strong buying during the period. Long red (solid) candles show strong selling pressure. The longer the body, the more intense the buying or selling that took place. On the other hand, the short candlesticks indicate little price movement and represent consolidation (tight price movement).
Keep in mind, even though much information can be gleaned from candlestick symbols, they don’t represent the sequences of events between the open and close, only the ending relationship between the open and close. The high and low of the period are obvious (tops and bottoms of the candlesticks including wicks), but the candlesticks cannot tell you which came first. That means that this particular information doesn’t means as much in your decision to purchase an option as information about where the stock closed at the end of the period.


Recent Comments