
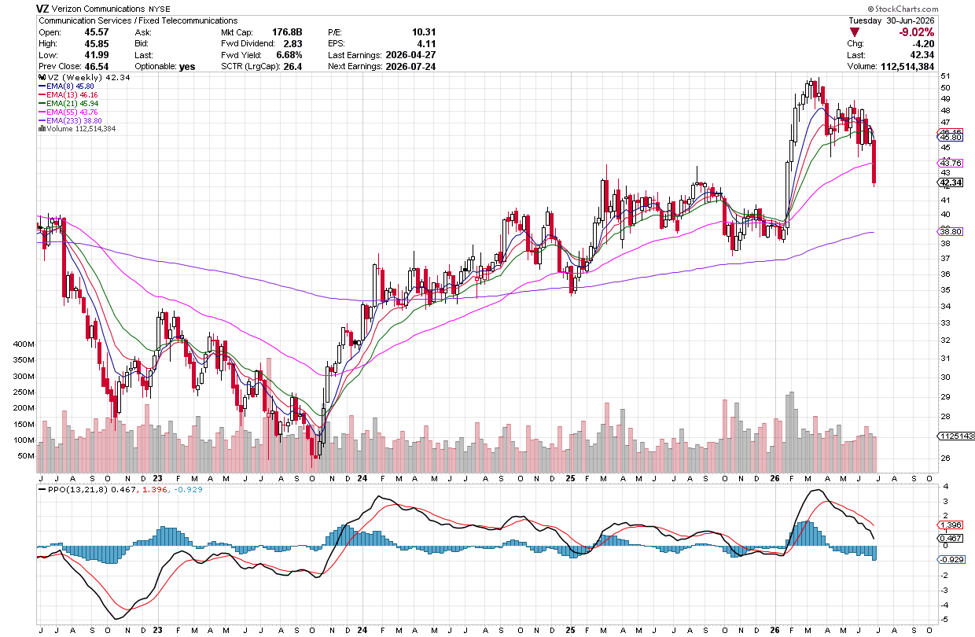
Verizon has broken down sharply after a strong multi-month advance, with this week’s large bearish candle slicing through both the 8-week EMA ($45.80) and 13-week EMA ($46.16) on heavy volume. The stock closed at $42.34, just below the rising 21-week EMA ($43.76), putting that level under immediate pressure. The decline appears to be more than simple profit-taking, as the size of the candle and increased volume suggest institutional selling. If the 21-week EMA fails to hold, the next significant support sits near the 233-week EMA around $38.80, which also aligns with prior consolidation from late 2025.
We start trading and invest massive numbers of hours learning so we can reduce the stress of financial burdens. The irony is that finding the next winning trade or watching the trade we are in can be nerve wracking. Here is a way to eliminate trading stress and be able to enjoy the benefit of all that hard work.
Momentum has deteriorated quickly. The PPO remains above zero, meaning the longer-term trend is still technically positive, but the PPO line has crossed below its signal line and the histogram continues to weaken, confirming downside momentum is accelerating. The previous bullish momentum surge has clearly faded.
Despite the recent weakness, the long-term uptrend has not been completely broken. As long as Verizon can stabilize near the 21-week EMA and reclaim the short-term moving averages, this could simply become a normal correction within a larger uptrend. However, continued closes below $43-$44 would increase the odds of a deeper retracement toward the high-$30s. For traders, patience is warranted. Rather than trying to catch the falling knife, it would be preferable to wait for evidence that buyers are returning, such as a bullish reversal candle,
Wishing you the best,
Wendy


Recent Comments