
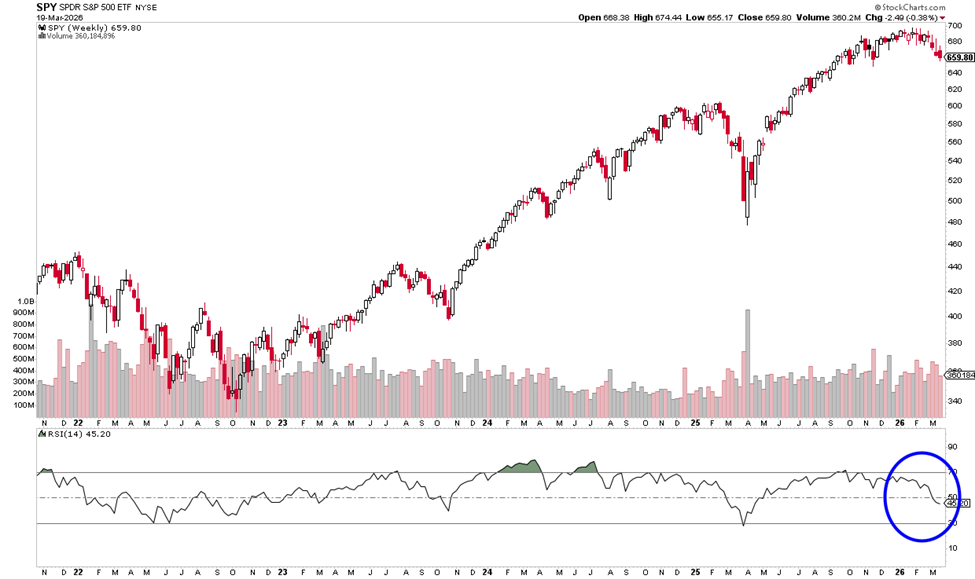
RSI (Relative Strength Index) is a momentum indicator that measures the strength of recent price moves on a scale from 0–100. Readings above 70 suggest overbought conditions, while below 30 indicate oversold. In strong uptrends, RSI often holds above the 40–50 range, acting as a “bullish support zone.”
Join me for a live demo and Q&A on my new DNA Indicator. It gave a signal to buy a put yesterday that has already doubled with room to bring in more profit. The session is at 1pm ET on Monday and you can grab a spot here.
On this chart, RSI has slipped below 50 and is hovering near 45, signaling a loss of short-term momentum. However, it is not yet oversold, suggesting this is more likely a healthy pullback rather than a trend reversal. If RSI stabilizes and turns higher near the 40 level, it would support continuation of the uptrend. A breakdown below 40 would indicate increasing weakness and the potential for a deeper pullback.
Wishing you the best,
Wendy


Recent Comments