
Looking at Ford through both the daily and weekly charts can help us understand the difference between short-term momentum and the broader trend.
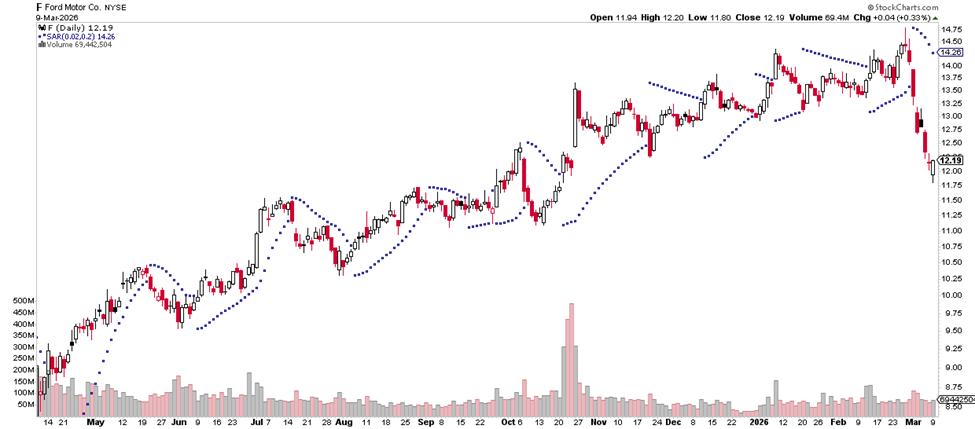
On the daily chart, Ford recently experienced a sharp pullback after trading near the $14–$15 range. The Parabolic SAR dots have flipped above the price, signaling that short-term momentum has turned bearish. This indicates selling pressure in the near term and suggests the stock may need time to stabilize before attempting another move higher.
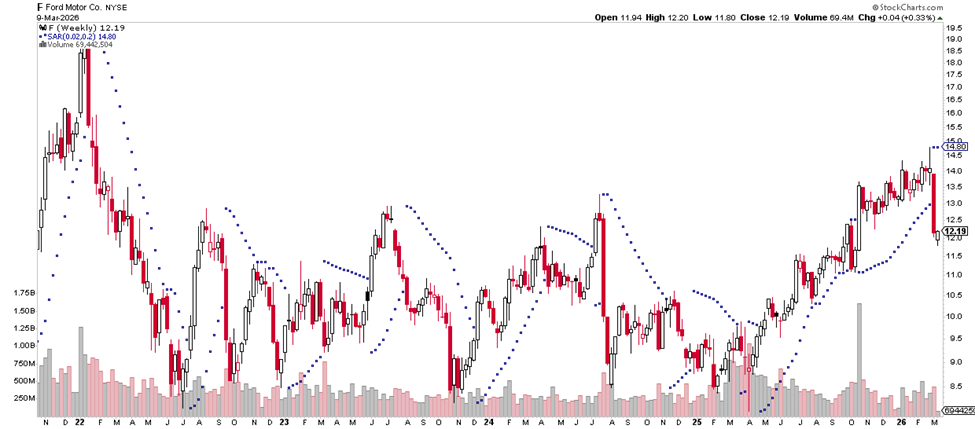
However, the weekly chart tells a slightly different story. While the most recent weekly candle reflects the same pullback, the broader pattern shows Ford gradually building higher lows over the past year, indicating an improving longer-term structure. The Parabolic SAR on the weekly timeframe has recently flipped as well, suggesting the rally may be pausing, but the larger recovery trend remains visible.
Wishing you the best,
Wendy Kirkland


Recent Comments