
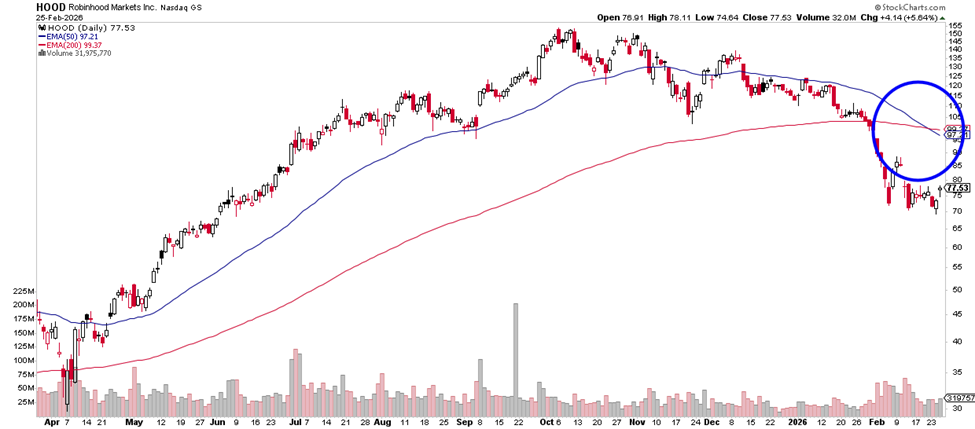
On the daily chart, HOOD has formed what’s known as a “Death Cross.” This occurs when the 50-day moving average falls below the 200-day moving average. In simple terms, it signals that recent price action has weakened enough to shift the longer-term trend lower.
Here is a new indicator I am using to spot these trades. The amazingly high accuracy rate isn’t even the best part. It is better than that. Let me explain here.
This pattern doesn’t guarantee further downside, but historically it often marks the beginning of a more sustained bearish phase rather than just a short pullback. When shorter-term momentum drops below the longer-term average, it shows sellers are gaining control.
For options traders, this type of trend shift can create opportunities on the put side — especially if price continues making lower highs and stays below both moving averages. As always, confirmation and risk management are key.
I wish you the very best,
Wendy


Recent Comments