
Dear Reader,
While I was watching the markets and today’s trading action, when I came across this one stock in particular, what I saw piqued my interest.
The trade that came over the wire just a few hours ago was for CrowdStrike Holdings, Inc. symbol: (CRWD).
It’s what I saw in CRWD’s stock chart that made this potential trade stand above the rest when I saw it today.
Take a look below at a current snapshot of CRWD’s stock chart and I’ll break down for you what I see when I see this chart.
 Unlock the door to profit opportunities! Join my Weekly Stock and Option Alert Newsletter for exclusive trade insights. Delve into multiple trade setups every week and receive actionable trade recommendations. Click here to sign up now!

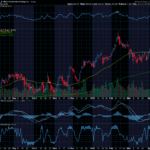
When looking at this stock chart for CrowdStrike Holdings, Inc., the first thing that stands out to me is the powerful technical ‘Buy’ signal that is currently flashing!
In this daily price chart, you can see there are also two Exponential Moving Averages (EMA) overlaid. The shorter term line is the 50-Day EMA and the longer term line is the 100-Day EMA.
The chart shows that in early November, as CRWD stock was beginning to gain steam and trade higher, the stock’s 50-Day EMA crossed above the 100-Day EMA. This created a brand new technical ‘Buy’ signal for CRWD shares.
When I come across a technical signal like this, I consider it a ‘Buy’ because the shorter term EMA is beginning to outpace the longer term EMA which is indicative of a sustained move higher.
In order for an EMA crossover like this to occur, strong buying pressure has to be generated for a stock, driving the shares higher. An EMA trading system like the 50/100-Day EMA system, is able to identify these sustained momentum thrusts when the crossover occurs offering traders an opportunity to jump in and participate in the move.
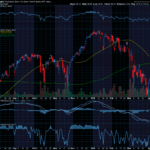
Now, even though the original crossover occurred a few months back, this does not mean it is too late to capitalize on the stock’s bullish trend. When stocks break out to the upside like this, the bullish trend can often last longer than one might think.
Since the 50-Day EMA is still trading above the 100-Day EMA, this means the ‘Buy’ signal is still intact and this trend is still tradable. Since this bullish trend is still in play, let’s discuss how I would look to place a trade on CRWD stock.
How I Would Look to Trade It
Since CRWD’s 50-Day EMA is still trading above the 100-Day EMA signaling the ‘Buy’, this is offering an attractive trading setup.
I want to look to trade CRWD’s trend and have the opportunity to capture some profits by placing an options trade on the stock.
Below is a Call Option Debit spread for CRWD that I found just this morning that would allow me to gain some exposure to the stock’s powerful bullish trend but also have some downside protection built in as well. Let me tell you how this works.
Once I place a Call Option Debit spread, it has the ability to profit if the underlying stock/ETF is either up, flat, or even down a bit at option expiration.
Below is a snapshot of my Call Option Debit Spread Calculator that shows the profit potential and downside protection analysis for my trade. This example examines a range of a 10.0% increase to a 10.0% decrease in CRWD share price at option expiration.

Looking at the trade analysis, the calculator shows that this one single trade, that would cost you only $560 to enter, has the ability to profit 78.6%.
The calculator reveals that if CRWD, at option expiration, were to increase, remain flat, or even drop by as much as 10.0%, this low-cost trade would be set up to make a 78.6% return!
This Call Option Debit Spread strategy has been one of my absolute favorites to trade over the years and remains so today. The key behind it all is that by enabling your ability to profit if a stock is up, flat, or even down a bit gives you a much higher probability that your trade will end up a winner.
The Hughes Optioneering Team is here to help you identify high-probability trades just like this one.
Interested in accessing the Optioneering Calculators? Join one of Chuck’s Trading Services for unlimited access! The Optioneering Team has option calculators for six different option strategies that allow you to calculate the profit potential for an option trade before you take the trade.
Brand New Phoenix Indicator!
Today was an exciting day here for my team! For the first time EVER, we revealed our latest suite of trading tools that we call Phoenix!
Our Phoenix trading suite includes a POWERFUL indicator & an Algo-based trade finder which can spot the strongest stocks in the market AND give you the exact strike we would look to trade.
I don’t want you to miss this Revolutionary new trading tool that we have created. Click Here to watch the replay of the session I held earlier today!
Wishing You the Best in Investing Success,

Chuck Hughes
Editor, Trade of the Day
Have any questions? Email us at dailytrade@chuckstod.com
*Trading incurs risk and some people lose money trading.


Recent Comments