by Adam Oliensis
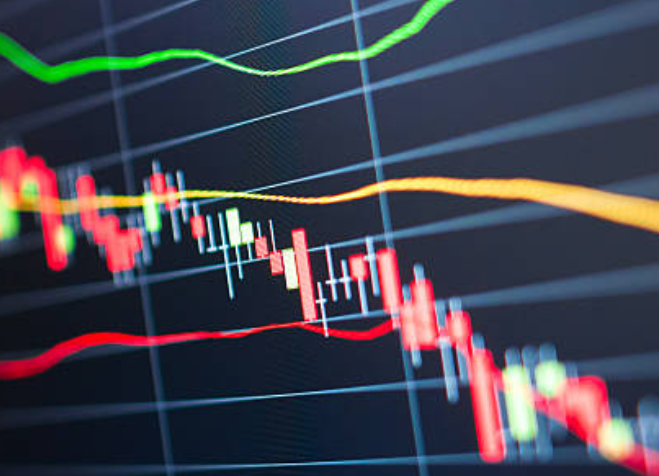
Japanese Candlesticks provide an excellent piece of the Technical Analysis puzzle. Each candle gives you the opening price, the low of the period, the high of the period, and the closing price. Because markets are fractal (they display similar properties in all time frames) the “period” of an individual candle may be daily, weekly, monthly, and so on. Or, with real time data feeds you can use one minute, five minute, or 10 minute, or hourly candles, etc. What period you choose depends on the time frame you want to trade.
Anatomy of a Candlestick
Below is a graphic showing a white candle and a dark candle.
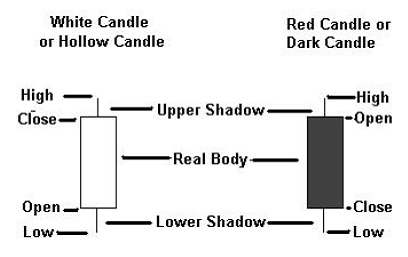
The white or hollow candle shows a period that has closed above its opening price. The dark candle shows a period that has closed below its opening price. The fat part of the candle (white or dark respectively) is called the Real Body. The skinny part of the candle is called the shadow or wick (or sometimes the tail). The real body of the dark candle may be filled in with black or red. We like to use red because it’s more evocative of danger… also ’cause it’s prettier… but in this example we use “dark” to contrast with “white.”
Candlesticks are visually useful and appealing. At a quick glance you can see a lot of information. As you get facile reading candlesticks, the flow of buying and selling pressure becomes more obvious and dynamic on a candlestick chart than on a line or bar chart. (A line chart gives you only the closing price and a bar chart gives you only the intraday range and the close.)
Using candlesticks you can see how intense a reaction was to a particular move. For instance, “The stock opened, dipped a bit, then shot up to the high, and backed off only slightly for the close.” Or, “The stock opened three points above yesterday’s close, moved up to the top of the wick $0.50 higher and then plummeted six points and closed at its low, which was $2.50 below yesterday’s low.”
Who Controls the Market?
Candlesticks can give you the answer to this question.
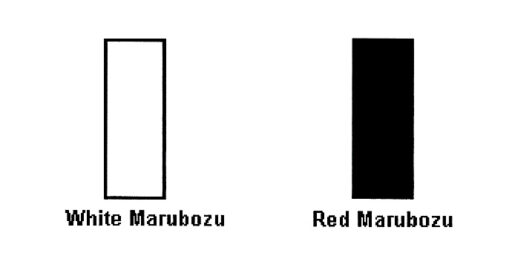
A Marubozu candlestick has no upper shadow or no lower shadow. A white marubozu opens at its low and closes at its high. A dark marubozu opens at its high and closes at its low. Who controls the market in each of these cases?
In the white candle above, the stock opened and moved up strongly (the candle is a long white one), never penetrating below the opening price and closing at the high of the day. And in the dark candle the stock did just the opposite, never penetrating up through the opening price and putting in a long dark candle, finally closing at the low of the day. Clearly the bulls controlled the white marubozu and the bears controlled the dark marubozu.
A candle with no lower shadow is said to have a ‘shaven bottom’ and a candle with no upper shadow is said to have a ‘shaven head’. A marubozu has both. But it’s not always that decisive a win for one side or the other.
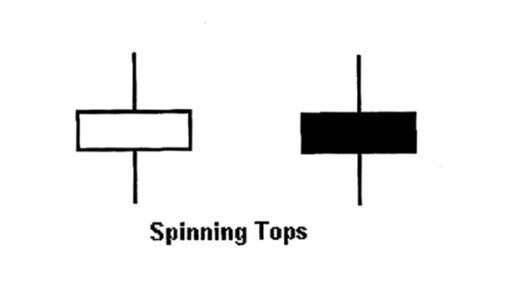
Who controlled these sessions? The white spinning top shows a slight advantage to the bulls and the dark spinning top shows a slight advantage to the bears. But what’s probably more important about these sessions is that they showed some back and forth, some churn, and didn’t net much movement one way or the other. Spinning tops are smallish candles and show that there was an argument between bulls and bears, and that they had to close the session without a clear-cut winner. It was something of a stalemate. It nets out to indecision, especially if we see light volume.
How about these sessions?
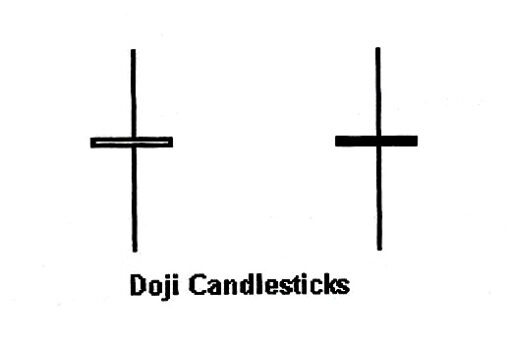
These Doji Candlesticks show an even more extreme version of what we saw in the spinning tops above. Here we have very long upper and lower shadows and teeny little real bodies, with the close virtually AT the opening price. Whether the close was up (white) or down (dark) isn’t what’s most notable here. What’s important is that there was a battle that extended far above and below the open, with one side gaining some large advantage within the candle, and then giving it up and retreating just as far in the other direction, before fighting back to a standoff.
Doji candlesticks can often portend a trend reversal, especially if put in on heavy volume.
There are a lot of individual candlestick formations. At times, though, an individual candle will make a statement, so to speak, that will have ambiguous or context-dependent implications.


Recent Comments