
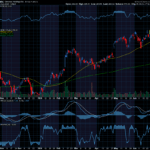
DexCom, Inc. (DXCM) appeared on our list of compressed stocks this morning. As you can see in the charts below, the stock has a history of making big moves soon after a compression signal. DXCM is a biotech company that makes continuous glucose monitoring systems that provide real-time data to patients with diabetes. From an options trader’s perspective, the 1-month implied volatility hasn’t been this low since August of 2021. This tells us that current options prices are cheap. In fact, our software’s unique ability to value the neutral option buying strategy that we prefer tells us that the strategy is trading at a 37% discount to its value.

This MDM Graph compares the modeled expectations of current options prices (the orange line) to the actual distribution of stock prices over the last year (the blue histogram). You can see in the chart that DXCM made big moves much more frequently than modeled options prices currently expect. This unique graph gives us the data that we need in order to determine an option’s true value. Be sure to tune in to our live coaching session today at 2 pm ET. We will be discussing some of the different ways we use this unique tool that you can’t get anywhere else.
This MDM Graph compares the modeled expectations of current options prices (the orange line) to the actual distribution of stock prices over the last year (the blue histogram). You can see in the chart that DXCM made big moves much more frequently than modeled options prices currently expect. This unique graph gives us the data that we need in order to determine an option’s true value. Be sure to tune in to our live coaching session today at 2 pm ET. We will be discussing some of the different ways we use this unique tool that you can’t get anywhere else.


This Volatility Cone chart shows the volatility expectations (the yellow dots) of each term relative to the historical volatility average (the blue line) and the extreme historical volatilities (the purple lines). To learn more about the Volatility Cone, click here. As you can see, all volatility expectations are below the 1-year historical average. This graph confirms that current options prices are cheap relative to the DXCM’s historical volatility over the past year.

The Volatility Term Structure shows that DXCM options expiring June 21st have low relative cost. To learn more about Volatility Term Structure, click here. We like to use monthly options expirations for buying options because they tend to have good liquidity.

DXCM’s stock price is compressed and the stock has a history of big moves within a few weeks after a compression signal. Its volatility expectations and relative options prices are as low as they’ve been since August of 2021. This is an option buying opportunity. Be sure to read the ODDS Online Daily Trade Idea report to get the details of our trade ideas for DXCM.

To access Odds Online Daily and be able to see any stock you are tracking in this software, click here.
Thank you,
Don Fishback


Recent Comments