
Dear Reader,
Yesterday, we looked at a Daily Price Chart of Verizon Communications Inc., noting that the stock’s OBV line is sloping down, validating the stock’s recent bearish trend.
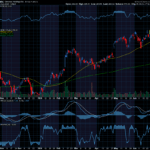
For today’s Trade of the Day e-letter we will be looking at a Moving Average Convergence/ Divergence (MACD) chart for Banner Corporation stock symbol: BANR.
Before breaking down BANR’s MACD chart let’s first review what products and services the company offers.
Banner Corporation operates as the bank holding company for Banner Bank that provide commercial banking and financial products and services to individuals, businesses, and public sector entities in the United States. It accepts various deposit instruments, including interest-bearing and non-interest-bearing checking accounts, money market deposit accounts, regular savings accounts, and certificates of deposit, as well as treasury management services and retirement savings plans.
MACD Indicator confirms Price Momentum
The BANR daily price chart below shows that BANR is in a price uptrend as the 24/52 day MACD line (black line) is above the 18-Day EMA (purple line). The Moving Average Convergence/ Divergence chart is shown below the daily price chart.
MACD uses moving averages to create a momentum indicator by subtracting the longer-term moving average from the shorter-term moving average. The MACD is calculated by subtracting a stock’s longer term 52-Day Exponential Moving Average (EMA) from its shorter term 24-Day EMA. This creates the MACD line.
MACD ‘Buy’ Signal
The 18-Day EMA line functions as a buy/sell ‘trigger’. When the 24/52 Day MACD line crosses above the 18-Day EMA line it indicates positive momentum and higher prices for the stock. When the 24/52 Day MACD lines crosses below the 18-Day EMA it indicates negative momentum and lower prices for the stock. MACD is more of a leading indicator than a moving average cross over which tends to lag price movement.
MACD Histogram shows Acceleration of Momentum
Also included in a MACD chart is the histogram bar graph. This portion of the chart helps to illustrate the distance between the 24/52 Day MACD and the 18-Day EMA.
When a crossover initially occurs, the histogram’s bar will be near flat as the two indicator lines have converged. As the lines begin to separate, the bars grow in height, indicating a widening gap and acceleration for the stock’s momentum. When the histogram’s bars begin to shrink this indicates a narrowing of the gap between the 24/52 Day MACD and the 18-Day EMA and a slowing of the stock’s momentum. When the gap between the two indicators begins to narrow, this typically indicates a crossover of the indicator lines could happen soon.

Buy BANR Stock
As long as the 24/52 Day MACD line remains above the 18-Day EMA, the stock is more likely to keep trading at new highs in the coming days and weeks.
Since BANR’s bullish run is likely to continue, the stock should be purchased.
Our initial price target for BANR stock is 75.00 per share.

80.9% Profit Potential for BANR Option
Now, since BANR’s 24/52 Day MACD is trading above the 18-Day EMA this means the stock’s bullish rally will likely continue. Let’s use the Hughes Optioneering calculator to look at the potential returns for a BANR call option purchase.
The Call Option Calculator will calculate the profit/loss potential for a call option trade based on the price change of the underlying stock/ETF at option expiration in this example from a flat BANR price to a 12.5% increase.
The Optioneering Team uses the 1% Rule to select an option strike price with a higher percentage of winning trades. In the following BANR option example, we used the 1% Rule to select the BANR option strike price but out of fairness to our paid option service subscribers we don’t list the strike price used in the profit/loss calculation.
Trade with Higher Accuracy
When you use the 1% Rule to select a BANR in-the-money option strike price, BANR stock only has to increase 1% for the option to breakeven and start profiting! Remember, if you purchase an at-the-money or out-of-the-money call option and the underlying stock closes flat at option expiration it will result in a 100% loss for your option trade! In this example, if BANR stock is flat at 67.29 at option expiration, it will only result in a 5.9% loss for the BANR option compared to a 100% loss for an at-the-money or out-of-the-money call option.
Using the 1% Rule to select an option strike price can result in a higher percentage of winning trades compared to at-the-money or out-of-the-money call options. This higher accuracy can give you the discipline needed to become a successful option trader and can help avoid 100% losses when trading options.
The goal of this example is to demonstrate the powerful profit potential available from trading options compared to stocks.
The prices and returns represented below were calculated based on the current stock and option pricing for BANR on 10/20/2022 before commissions.
When you purchase a call option, there is no limit on the profit potential of the call if the underlying stock continues to move up in price.
For this specific call option, the calculator analysis below reveals if BANR stock increases 5.0% at option expiration to 70.65 (circled), the call option would make 37.5% before commission.
If BANR stock increases 10.0% at option expiration to 74.02 (circled), the call option would make 80.9% before commission and outperform the stock return more than 8 to 1*.
The leverage provided by call options allows you to maximize potential returns on bullish stocks.
The Hughes Optioneering Team is here to help you identify winning trades just like this one.

Interested in accessing the Optioneering Calculators? Join one of Chuck’s Trading Services for unlimited access! The Optioneering Team has option calculators for six different option strategies that allow you to calculate the profit potential for an option trade before you take the trade.
Chuck’s $3,000 Trading Scholarship
I don’t want you to miss a single opportunity to potentially reach your goals. That’s why I’d like to offer you a scholarship of the full $3,000 Enrollment Fee of my exclusive Inner Circle Trading Service.
I want you to follow in my footsteps and succeed beyond your wildest dreams, so please call Brad in my office at 1-866-661-5664 or 1-310-647-5664 and get started today!
You can also CLICK HERE to schedule a call now!
Wishing You the Best in Investing Success,

Chuck Hughes
Editor, Trade of the Day
Have any questions? Email us at dailytrade@chuckstod.com
*Trading incurs risk and some people lose money trading.


Recent Comments