
Dear Reader,
Yesterday, we looked at a Daily Price Chart of FTI Consulting, Inc. noting that the stock’s 24/52 Day MACD is trading above the 18-Day EMA signaling a ‘Buy’.
For today’s Trade of the Day we will be looking at an On Balance Volume chart for NVIDIA Corp. stock symbol: NVDA.
Before breaking down NVDA’s OBV chart let’s first review which products and services are offered by the company.
NVIDIA Corporation provides graphics, and compute and networking solutions in the United States, Taiwan, China, and internationally. The company’s Graphics segment offers GeForce GPUs for gaming and PCs, the GeForce NOW game streaming service and related infrastructure, and solutions for gaming platforms; Quadro/NVIDIA RTX GPUs for enterprise workstation graphics; vGPU software for cloud-based visual and virtual computing; automotive platforms for infotainment systems; and Omniverse software for building 3D designs and virtual worlds.
Confirming a Price Downtrend with OBV
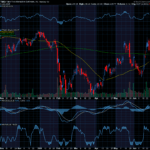
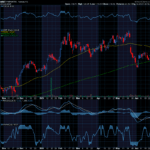
The NVDA daily price chart below shows that NVDA is in a price downtrend as the current price is below the price NVDA traded at five months ago (circled). The On Balance Volume chart is below the daily chart.
On Balance Volume measures volume flow with a single Easy-to-Read Line. Volume flow precedes price movement and helps sustain the price downtrend. When a stock closes up, volume is added to the line. When a stock closes down, volume is subtracted from the line. A cumulative total of these additions and subtractions form the OBV line.
On Balance Volume Indicator
● When Close is Up, Volume is Added
● When Close is Down, Volume is Subtracted
● A Cumulative Total of Additions and Subtractions form the OBV Line
Volume flow precedes price and is the key to measuring the validity and sustainability of a price trend.
We can see from the OBV chart below that the On Balance Volume line for NVDA is sloping down. A down-sloping line indicates that the volume is heavier on down days and selling pressure is exceeding buying pressure. Selling pressure must continue to exceed buying pressure in order to sustain a price downtrend. So, On Balance Volume is a simple indicator to use that confirms the price downtrend and its sustainability.
The numerical value of the On Balance Volume line is not important. We simply want to see a down-sloping line to confirm a price downtrend.

Confirmed ‘Sell’ Signal for NVDA
Since NVDA’s OBV line is sloping down, the most likely future price movement for NVDA is down, making NVDA a good candidate for a put option debit spread.
Let’s use the Hughes Optioneering calculator to look at the potential returns for a NVDA debit spread.
The Put Option Spread Calculator will calculate the profit/loss potential for a put option spread based on the price change of the underlying stock/ETF at option expiration in this example from a 10.0% decrease to a 10.0% increase in NVDA stock at option expiration.
The goal of this example is to demonstrate the ‘built in’ profit potential for option spreads and the ability of spreads to profit if the underlying stock is down, up, or flat at option expiration. Out of fairness to our paid option service subscribers we don’t list the option strike prices used in the profit/loss calculation.
The prices and returns represented below were calculated based on the current stock and option pricing for NVDA on 7/12/2022 before commissions.

Built in Profit Potential
For this option spread, the calculator analysis below reveals the cost of the spread is $658 (circled). The maximum risk for an option spread is the cost of the spread.
The analysis reveals that if NVDA stock is flat or down at all at expiration the spread will realize a 52.0% return (circled).
And if NVDA stock increases 10.0% at option expiration, the option spread would make a 38.3% return (circled).
Due to option pricing characteristics, this option spread has a ‘built in’ 52.0% profit potential when the trade was initiated*.
Option spread trades can result in a higher percentage of winning trades compared to a directional option trade if you can profit when the underlying stock/ETF is up, down or flat.
A higher percentage of winning trades can give you the discipline needed to become a successful trader
The Hughes Optioneering Team is here to help you identify winning trades just like this one.

Interested in accessing the Optioneering Calculators? Join one of Chuck’s Trading Services for unlimited access! The Optioneering Team has option calculators for six different option strategies that allow you to calculate the profit potential for an option trade before you take the trade.
Average Trade Return of 266.5%
Below is a screenshot of the current open trade profit opportunities from Chuck’s Inner Circle Trading Service. There are currently $211,718.94 in open trade profits with an average trade return of 266.5% demonstrating the ability of the Optioneering Strategy to deliver substantial returns with no losing portfolios**.

** Open trade profit results represent the open trade profit performance for the portfolio displayed on the day the snapshot was taken. Open trade profits may have increased or decreased when trades were closed out.
Chuck’s $3,000 Trading Scholarship
I don’t want you to miss a single opportunity to potentially reach your goals. That’s why I’d like to offer you a scholarship of the full $3,000 Enrollment Fee of my exclusive Inner Circle Trading Service.
I want you to follow in my footsteps and succeed beyond your wildest dreams, so please call Brad in my office at 1-866-661-5664 or 1-310-647-5664 and get started today!
You can also CLICK HERE to schedule a call now!
Wishing You the Best in Investing Success,
 Chuck Hughes
Editor, Trade of the Day
Have any questions? Email us at dailytrade@chuckstod.com
*Trading incurs risk and some people lose money trading.


Recent Comments