
Dear Reader,
Yesterday, we looked at a Daily Price Chart of Wrestling Entertainment, Inc., noting that the stock’s OBV line is sloping up, validating the recent bullish trend.
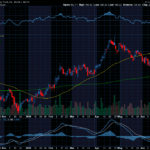
For today’s Trade of the Day e-letter we will be looking at a monthly chart for the SPDR S&P Oil & Gas Exploration & Production ETF, symbol: XOP.
Before breaking down XOP’s monthly chart let’s first review the investment objective of the ETF.
The XOP ETF seeks to track the performance of the S&P Oil & Gas Exploration & Production Select Industry Index, the fund employs a sampling strategy. It generally invests substantially all, but at least 80%, of its total assets in the securities comprising the index. The index represents the oil and gas exploration and production segment of the S&P Total Market Index.
Now, let’s begin to break down the monthly chart for the XOP ETF.
Below is a 10-Month Simple Moving Average chart for the XOP ETF.

Buy the XOP ETF
As the chart shows, in November 2020, the XOP 1-Month Price, crossed above the 10-Month simple moving average (SMA).
This crossover indicated the buying pressure for XOP exceeded the selling pressure. For this kind of crossover to occur, an ETF has to be in a strong bullish uptrend.
Now, as you can see, the 1-Month Price is still above the 10-Month SMA. That means the bullish trend is still in play!
As long as the 1-Month price remains above the 10-Month SMA, the ETF is more likely to keep trading at new highs and should be purchased.
Our initial price target for the XOP ETF is 152.00 per share.

Profit if XOP is Up, Down or Flat
Now, since XOP’s Monthly Price is currently trading above the 10-Month SMA and will likely rally from here, let’s use the Hughes Optioneering calculator to look at the potential returns for an XOP call option spread.
The Call Option Spread Calculator will calculate the profit/loss potential for a call option spread based on the price change of the underlying stock/ETF at option expiration in this example from a 10.0% increase to a 10.0% decrease in the XOP ETF at option expiration.
The goal of this example is to demonstrate the ‘built in’ profit potential for option spreads and the ability of spreads to profit if the underlying ETF is up, down or flat at option expiration. Out of fairness to our paid option service subscribers we don’t list the option strike prices used in the profit/loss calculation.
The prices and returns represented below were calculated based on the current ETF and option pricing for XOP on 8/22/2022 before commissions.
Built in Profit Potential
For this option spread, the calculator analysis below reveals the cost of the spread is $292 (circled). The maximum risk for an option spread is the cost of the spread.
The analysis reveals that if the XOP ETF is flat or up at all at expiration the spread will realize a 71.2% return (circled).
And if the XOP ETF decreases 10.0% at option expiration, the option spread would make a 40.3% return (circled).
Due to option pricing characteristics, this option spread has a ‘built in’ 71.2% profit potential when the trade was initiated*.
Option spread trades can result in a higher percentage of winning trades compared to a directional option trade if you can profit when the underlying stock/ETF is up, down or flat.
A higher percentage of winning trades can give you the discipline needed to become a successful trader.
The Hughes Optioneering Team is here to help you identify profit opportunities just like this one.

Interested in accessing the Optioneering Calculators? Join one of Chuck’s Trading Services for unlimited access! The Optioneering Team has option calculators for six different option strategies that allow you to calculate the profit potential for an option trade before you take the trade.
Trade High Priced Stocks for $350 With Less Risk
One of the big advantages to trading option spreads is that spreads allow you to trade high price stocks like Amazon, Google, or Netflix for as little as $350. With an option spread you can control 100 shares of Google for $350. If you were to purchase 100 shares of Google at current prices it would cost about $11,000. With the stock purchase you are risking $11,000 but with a Google option spread that costs $350 your maximum risk is $350 so your dollar risk is lower with option spreads compared to stock purchases.
Afraid of Market Volatility Rocking Your IRA?
Chuck Hughes isn’t afraid of market volatility, he takes advantage of it. Chuck is used to turbulence.
His years as a pilot gave him the ability to weather even the worst storms.
He has tested and proven strategies that thrive during turbulent market conditions*.
You could gain access to these strategies and start receiving hand picked trades from Chuck today!
Just call Brad at 1-866-661-5664 or 1-310-647-5664 to join his Inner Circle Trading Service or you can CLICK HERE to schedule a call!
Wishing You the Best in Investing Success,

Chuck Hughes
Editor, Trade of the Day
Have any questions? Email us at dailytrade@chuckstod.com
*Trading incurs risk and some people lose money trading.


Recent Comments