
Dear Reader,
Yesterday, we looked at a Monthly Price Chart of Equinor ASA, noting that the stock’s 1-Month Price is trading above the 10-Month SMA.
For today’s Trade of the Day we will be looking at an On Balance Volume chart for ShockWave Medical, Inc. stock symbol: SWAV.
Before breaking down SWAV’s OBV chart let’s first review which products and services are offered by the company.
ShockWave Medical, Inc., a medical device company, engages in developing and commercializing intravascular lithotripsy technology for the treatment of calcified plaque in patients with peripheral vascular, coronary vascular, and heart valve diseases worldwide. The company offers M5 catheters for treating above-the-knee peripheral artery disease (PAD); C2 catheters for treating coronary artery disease; and S4 catheters for treating below-the-knee PAD.
Confirming a Price Uptrend with OBV
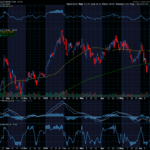
The SWAV daily price chart below shows that SWAV is in a price uptrend as the current price is above the price SWAV traded at six months ago (circled). The On Balance Volume chart is below the daily chart.
On Balance Volume measures volume flow with a single Easy-to-Read Line. Volume flow precedes price movement and helps sustain the price uptrend. When a stock closes up, volume is added to the line. When a stock closes down, volume is subtracted from the line. A cumulative total of these additions and subtractions form the OBV line.
On Balance Volume Indicator
● When Close is Up, Volume is Added
● When Close is Down, Volume is Subtracted
● A Cumulative Total of Additions and Subtractions form the OBV Line
Volume flow precedes price and is the key to measuring the validity and sustainability of a price trend.
We can see from the OBV chart below that the On Balance Volume line for SWAV is sloping up. An up-sloping line indicates that the volume is heavier on up days and buying pressure is exceeding selling pressure. Buying pressure must continue to exceed selling pressure in order to sustain a price uptrend. So, On Balance Volume is a simple indicator to use that confirms the price uptrend and its sustainability.
The numerical value of the On Balance Volume line is not important. We simply want to see an up-sloping line to confirm a price uptrend.

Confirmed ‘Buy’ Signal for SWAV
Since SWAV’s OBV line is sloping up, the most likely future price movement for SWAV is up, making SWAV a good candidate for a stock purchase or a call option spread.
Let’s use the Hughes Optioneering calculator to look at the potential returns for an SWAV debit spread.
The Call Option Spread Calculator will calculate the profit/loss potential for a call option spread based on the price change of the underlying stock/ETF at option expiration in this example from a 7.5% increase to a 7.5% decrease in SWAV stock at option expiration.
The goal of this example is to demonstrate the ‘built in’ profit potential for option spreads and the ability of spreads to profit if the underlying stock is up, down or flat at option expiration. Out of fairness to our paid option service subscribers we don’t list the option strike prices used in the profit/loss calculation.
The prices and returns represented below were calculated based on the current stock and option pricing for SWAV on 8/29/2022 before commissions.

Built in Profit Potential
For this option spread, the calculator analysis below reveals the cost of the spread is $1,100 (circled). The maximum risk for an option spread is the cost of the spread.
The analysis reveals that if SWAV stock is flat or up at all at expiration the spread will realize a 81.8% return (circled).
And if SWAV stock decreases 7.5% at option expiration, the option spread would make a 53.0% return (circled).
Due to option pricing characteristics, this option spread has a ‘built in’ 81.8% profit potential when the trade was initiated*.
Option spread trades can result in a higher percentage of winning trades compared to a directional option trade if you can profit when the underlying stock/ETF is up, down or flat.
A higher percentage of winning trades can give you the discipline needed to become a successful trader.
The Hughes Optioneering Team is here to help you identify profit opportunities just like this one.

Interested in accessing the Optioneering Calculators? Join one of Chuck’s Trading Services for unlimited access! The Optioneering Team has option calculators for six different option strategies that allow you to calculate the profit potential for an option trade before you take the trade.
Trade High Priced Stocks for $350 With Less Risk
One of the big advantages to trading option spreads is that spreads allow you to trade high price stocks like Amazon, Google, or Netflix for as little as $350. With an option spread you can control 100 shares of Google for $350. If you were to purchase 100 shares of Google at current prices it would cost about $11,000. With the stock purchase you are risking $11,000 but with a Google option spread that costs $350 your maximum risk is $350 so your dollar risk is lower with option spreads compared to stock purchases.
Afraid of Market Volatility Rocking Your IRA?
Chuck Hughes isn’t afraid of market volatility, he takes advantage of it. Chuck is used to turbulence.
His years as a pilot gave him the ability to weather even the worst storms.
He has tested and proven strategies that thrive during turbulent market conditions*.
You could gain access to these strategies and start receiving hand picked trades from Chuck today!
Just call Brad at 1-866-661-5664 or 1-310-647-5664 to join his Inner Circle Trading Service or you can CLICK HERE to schedule a call!
Wishing You the Best in Investing Success,

Chuck Hughes
Editor, Trade of the Day
Have any questions? Email us at dailytrade@chuckstod.com
*Trading incurs risk and some people lose money trading.


Recent Comments