
Dear Reader,
Yesterday, we looked at a Monthly Price Chart of Oracle Corp., noting that the stock’s 1-Month Price is trading below the 10-Month SMA signaling a ‘Sell’.
For today’s Trade of the Day e-letter we will be looking at a Moving Average Convergence/ Divergence (MACD) chart for Moody’s Corp. stock symbol: MCO.
Before breaking down MCO’s MACD chart let’s first review what products and services the company offers.
Moody’s Corporation operates as an integrated risk assessment firm worldwide. It operates in two segments, Moody’s Investors Service and Moody’s Analytics. The Moody’s Investors Service segment publishes credit ratings and provides assessment services on various debt obligations, programs and facilities, and entities that issue such obligations, such as various corporate, financial institution, and governmental obligations, as well as and structured finance securities.
MACD Indicator confirms Price Momentum
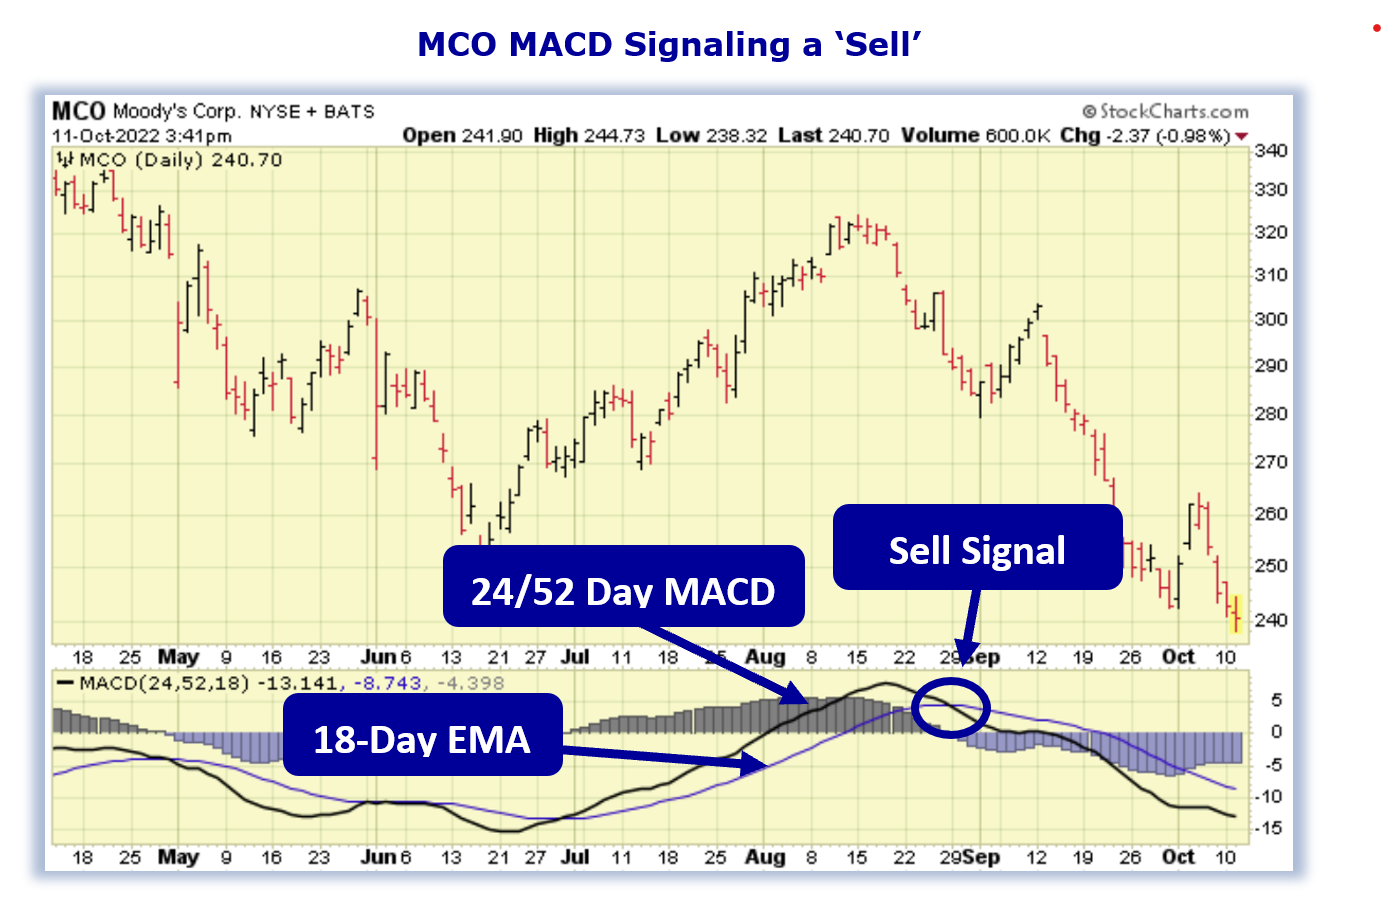
The MCO daily price chart below shows that MCO is in a price downtrend as the 24/52 day MACD line (black line) is below the 18-Day EMA (purple line). The Moving Average Convergence/ Divergence chart is shown below the daily price chart.
MACD uses moving averages to create a momentum indicator by subtracting the longer-term moving average from the shorter-term moving average. The MACD is calculated by subtracting a stock’s longer term 52-Day Exponential Moving Average (EMA) from its shorter term 24-Day EMA. This creates the MACD line.
MACD ‘Sell’ Signal
The 18-Day EMA line functions as a buy/sell ‘trigger’. When the 24/52 Day MACD line crosses above the 18-Day EMA line it indicates positive momentum and higher prices for the stock. When the 24/52 Day MACD lines crosses below the 18-Day EMA it indicates negative momentum and lower prices for the stock. MACD is more of a leading indicator than a moving average cross over which tends to lag price movement.
MACD Histogram shows Acceleration of Momentum
Also included in a MACD chart is the histogram bar graph. This portion of the chart helps to illustrate the distance between the 24/52 Day MACD and the 18-Day EMA.
When a crossover initially occurs, the histogram’s bar will be near flat as the two indicator lines have converged. As the lines begin to separate, the bars grow in height, indicating a widening gap and acceleration for the stock’s momentum. When the histogram’s bars begin to shrink this indicates a narrowing of the gap between the 24/52 Day MACD and the 18-Day EMA and a slowing of the stock’s momentum. When the gap between the two indicators begins to narrow, this typically indicates a crossover of the indicator lines could happen soon.
Sell MCO Stock
As long as the 24/52 Day MACD line remains below the 18-Day EMA, the stock is more likely to keep trading at new lows in the coming days and weeks.
Since MCO’s bearish run is likely to continue, bearish positions should be initiated.
Our initial price target for MCO stock is 228.00 per share.

Profit if MCO is Down, Up, or Flat
Now, since MCO’s 24/52 Day MACD is trading below the 18-Day EMA, the stock will likely continue its trend downward. Let’s use the Hughes Optioneering calculator to look at the potential returns for a MCO put option spread.
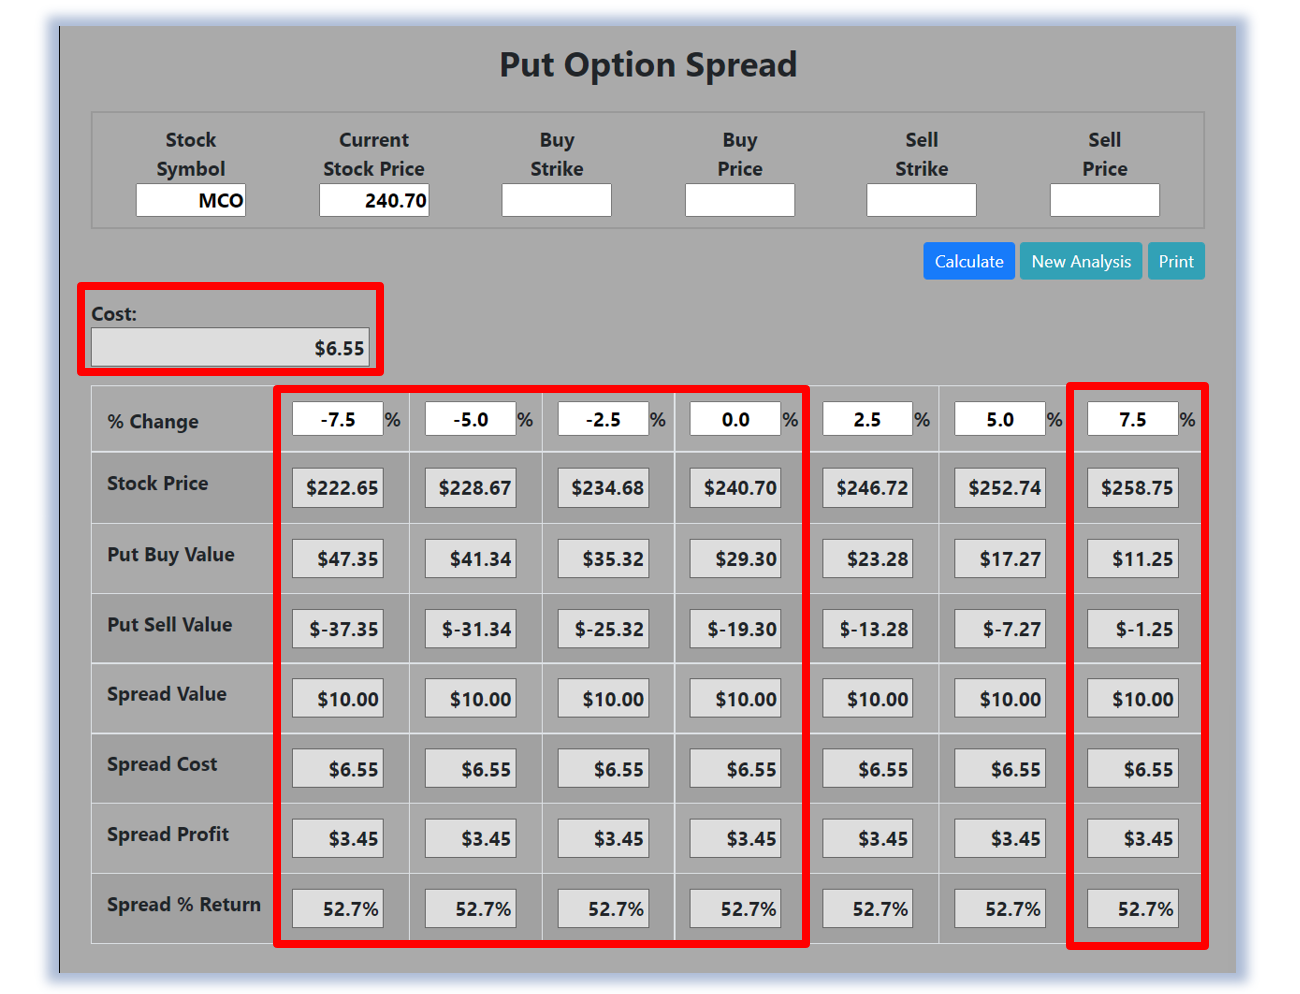
The Put Option Spread Calculator will calculate the profit/loss potential for a put option spread based on the price change of the underlying stock/ETF at option expiration in this example from a 7.5% decrease to a 7.5% increase in MCO stock at option expiration.
The goal of this example is to demonstrate the ‘built in’ profit potential for option spreads and the ability of spreads to profit if the underlying stock is down, up, or flat at option expiration. Out of fairness to our paid option service subscribers we don’t list the option strike prices used in the profit/loss calculation.
The prices and returns represented below were calculated based on the current stock and option pricing for MCO on 10/11/2022 before commissions.
Built in Profit Potential
For this option spread, the calculator analysis below reveals the cost of the spread is $655 (circled). The maximum risk for an option spread is the cost of the spread.
The analysis reveals that if MCO stock is flat or down at all at expiration the spread will realize a 52.7% return (circled).
And if MCO stock increases 7.5% at option expiration, the option spread would make a 52.7% return (circled).
Due to option pricing characteristics, this option spread has a ‘built in’ 52.7% profit potential when the trade was identified*.
Option spread trades can result in a higher percentage of winning trades compared to a directional option trade if you can profit when the underlying stock/ETF is up, down or flat.
A higher percentage of winning trades can give you the discipline needed to become a successful trader.
The Hughes Optioneering Team is here to help you identify profit opportunities just like this one.
Interested in accessing the Optioneering Calculators? Join one of Chuck‘s Trading Services for unlimited access! The Optioneering Team has option calculators for six different option strategies that allow you to calculate the profit potential for an option trade before you take the trade.
Trade High Priced Stocks for $350 With Less Risk
One of the big advantages to trading option spreads is that spreads allow you to trade high price stocks like Amazon, Google, Netflix or Apple for as little as $350. With an option spread you can control 100 shares of Netflix for $350. If you were to purchase 100 shares of Netflix at current prices it would cost about $21,000. With the stock purchase you are risking $21,000 but with a Netflix option spread that costs $350 your maximum risk is $350 so your dollar risk is lower with option spreads compared to stock purchases.
Get Trade Insights Directly From Chuck
You can start getting market insights directly from 10-Time Trading Champion Chuck Hughes.
See what he’s trading and when with his exclusive Inner Circle Trading Service where he will send you his hand-picked stock and option trades.
Just call Brad at 1-866-661-5664 or 1-310-647-5664 to join or CLICK HERE to schedule a call!
Wishing You the Best in Investing Success,

Chuck Hughes
Editor, Trade of the Day
Have any questions? Email us at dailytrade@chuckstod.com
*Trading incurs risk and some people lose money trading.


Recent Comments