
Dear Reader,
Yesterday, we looked at a Monthly Price Chart of Goldman Sachs Group, Inc. noting the stock’s 1-Month Price is trading above the 10-Month SMA signaling a ‘Buy’.
For today’s Trade of the Day we will be looking at a Daily Price chart for Hasbro, Inc. stock symbol: HAS.
Before breaking down HAS’s daily price chart let’s first review which products and services are offered by the company.
Hasbro, Inc., together with its subsidiaries, operates as a play and entertainment company. Its Consumer Products segment engages in the sourcing, marketing, and sale of toy and game products. This segment also promotes its brands through the out-licensing of trademarks, characters, and other brand and intellectual property rights to third parties through the sale of branded consumer products, such as toys and apparels.
Now, let’s begin to break down the Daily Price chart for HAS. Below is a Daily Price Chart with the price line displayed by an OHLC bar.

Sell HAS Stock
The Daily Price chart above shows that HAS stock has been hitting new 52-Week Lows regularly over the past month.
Simply put, a stock does not just continually hit a series of new 52-Week Lows unless it is in a very strong bearish trend.
The Hughes Optioneering team looks for stocks that are making a series of 52-Week Lows as this is a good indicator that the stock is in a powerful downtrend.
You see, after a stock makes a series of two or more 52-Week Lows, the stock typically continues its price downtrend and bearish positions should be initiated.
Our initial price target for HAS stock is 53.50 per share.

90.6% Profit Potential for HAS Option
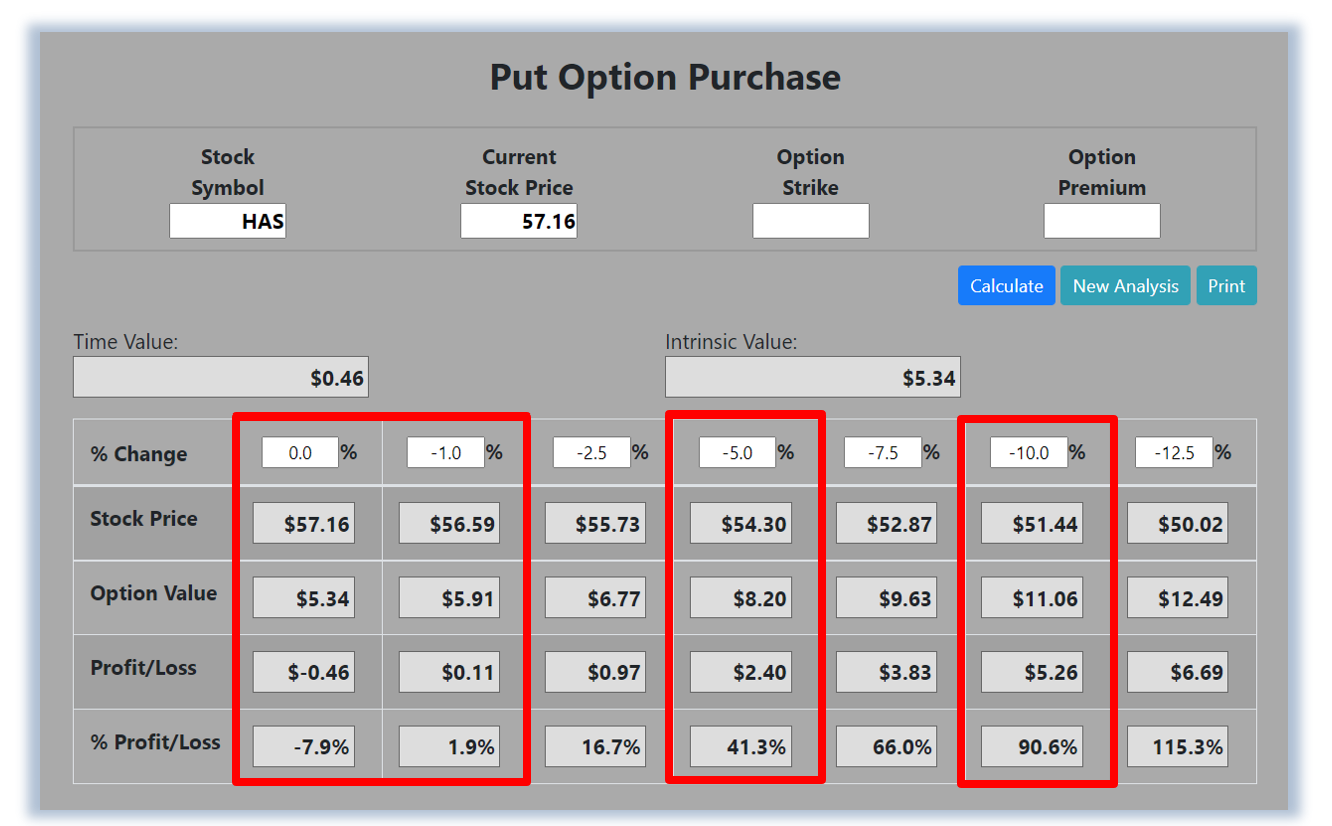
Now, since HAS stock is currently making a series of new 52-Week Lows this means the stock’s bearish decline will likely continue. Let’s use the Hughes Optioneering calculator to look at the potential returns for a HAS put option purchase.
The Put Option Calculator will calculate the profit/loss potential for a put option trade based on the price change of the underlying stock/ETF at option expiration in this example from a flat HAS price to a 12.5% decrease.
The Optioneering Team uses the 1% Rule to select an option strike price with a higher percentage of winning trades. In the following HAS option example, we used the 1% Rule to select the HAS option strike price but out of fairness to our paid option service subscribers we don’t list the strike price used in the profit/loss calculation.
Trade with Higher Accuracy
When you use the 1% Rule to select a HAS in-the-money option strike price, HAS stock only has to decrease 1% for the option to breakeven and start profiting! Remember, if you purchase an at-the-money or out-of-the-money put option and the underlying stock closes flat at option expiration it will result in a 100% loss for your option trade! In this example, if HAS stock is flat at 57.16 at option expiration, it will only result in a 7.9% loss for the HAS option compared to a 100% loss for an at-the-money or out-of-the-money put option.
Using the 1% Rule to select an option strike price can result in a higher percentage of winning trades compared to at-the-money or out-of-the-money put options. This higher accuracy can give you the discipline needed to become a successful option trader and can help avoid 100% losses when trading options.
The goal of this example is to demonstrate the powerful profit potential available from trading options compared to stocks.
The prices and returns represented below were calculated based on the current stock and option pricing for HAS on 11/14/2022 before commissions.
When you purchase a put option, there is virtually no limit on the profit potential of the put if the underlying stock continues to decline in price.
For this specific put option, the calculator analysis below reveals if HAS stock decreases 5.0% at option expiration to 54.30 (circled), the put option would make 41.3% before commission.
If HAS stock decreases 10.0% at option expiration to 51.44 (circled), the put option would make 90.6% before commission and would greatly outperform the stock’s return*.
The leverage provided by put options allows you to maximize potential returns on bearish stocks.
The Hughes Optioneering Team is here to help you identify profit opportunities just like this one.
Interested in accessing the Optioneering Calculators? Join one of Chuck’s Trading Services for unlimited access! The Optioneering Team has option calculators for six different option strategies that allow you to calculate the profit potential for an option trade before you take the trade.
Get Trade Insights Directly From Chuck
You can start getting market insights directly from 10-Time Trading Champion Chuck Hughes.
See what he’s trading and when with his exclusive Inner Circle Trading Service where he will send you his hand-picked stock and option trades.
Just call Brad at 1-866-661-5664 or 1-310-647-5664 to join or CLICK HERE to schedule a call!
Wishing You the Best in Investing Success,

Chuck Hughes
Editor, Trade of the Day
Have any questions? Email us at dailytrade@chuckstod.com
*Trading incurs risk and some people lose money trading.


Recent Comments