
Dear Reader,
Yesterday, we looked at a Daily Price Chart for Avalonbay Communities, Inc., noting that the stock’s OBV line is sloping down, validating the recent bearish trend.
For today’s Trade of the Day we will be looking at a Daily Price chart for Starbucks Corp. stock symbol: SBUX.
Before breaking down SBUX’s daily price chart let’s first review which products and services are offered by the company.
Starbucks Corporation, together with its subsidiaries, operates as a roaster, marketer, and retailer of specialty coffee worldwide. The company operates through three segments: North America, International, and Channel Development. Its stores offer coffee and tea beverages, roasted whole beans and ground coffees, single serve products, and ready-to-drink beverages; and various food products, such as pastries, breakfast sandwiches, and lunch items.
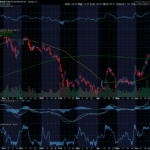
Now, let’s begin to break down the Daily Price chart for SBUX. Below is a Daily Price Chart with the price line displayed by an OHLC bar.

Buy SBUX Stock
The Daily Price chart above shows that SBUX stock began reaching a series of higher highs and higher lows in early January.
This pattern of bullish trading suggests the stock will march on to a further advance.
You see, after a stock makes a series of two or more higher highs and higher lows, the stock typically continues its price up trend and should be purchased.
Our initial price target for SBUX stock is 112.00 per share.

Profit if SBUX is Up, Down or Flat
Now, since SBUX stock is currently making a series of higher highs and higher lows and will likely rally from here, let’s use the Hughes Optioneering calculator to look at the potential returns for a SBUX call option spread.
The Call Option Spread Calculator will calculate the profit/loss potential for a call option spread based on the price change of the underlying stock/ETF at option expiration in this example from a 7.5% increase to a 7.5% decrease in SBUX stock at option expiration.
The goal of this example is to demonstrate the ‘built in’ profit potential for option spreads and the ability of spreads to profit if the underlying stock is up, down or flat at option expiration. Out of fairness to our paid option service subscribers we don’t list the option strike prices used in the profit/loss calculation.
The prices and returns represented below were calculated based on the current stock and option pricing for SBUX on 1/11/2023 before commissions.
Built in Profit Potential
For this option spread, the calculator analysis below reveals the cost of the spread is $325 (circled). The maximum risk for an option spread is the cost of the spread.
The analysis reveals that if SBUX stock is flat or up at all at expiration the spread will realize a 53.8% return (circled).
And if SBUX stock decreases 7.5% at option expiration, the option spread would make a 53.8% return (circled).
Due to option pricing characteristics, this option spread has a ‘built in’ 53.8% profit potential when the trade was identified*.
Option spread trades can result in a higher percentage of winning trades compared to a directional option trade if you can profit when the underlying stock/ETF is up, down or flat.
A higher percentage of winning trades can give you the discipline needed to become a successful trader.
The Hughes Optioneering Team is here to help you identify profit opportunities just like this one.

Interested in accessing the Optioneering Calculators? Join one of Chuck’s Trading Services for unlimited access! The Optioneering Team has option calculators for six different option strategies that allow you to calculate the profit potential for an option trade before you take the trade.
Trade High Priced Stocks for $350 With Less Risk
One of the big advantages to trading option spreads is that spreads allow you to trade high price stocks like Amazon, Google, or Netflix for as little as $350. With an option spread you can control 100 shares of Netflix for $350. If you were to purchase 100 shares of Netflix at current prices it would cost about $33,000. With the stock purchase you are risking $33,000 but with a Netflix option spread that costs $350 your maximum risk is $350 so your dollar risk is lower with option spreads compared to stock purchases.
Get Trade Insights Directly From Chuck
You can start getting market insights directly from 10-Time Trading Champion Chuck Hughes.
See what he’s trading and when with his exclusive Inner Circle Trading Service where he will send you his hand-picked stock and option trades.
Just call Brad at 1-866-661-5664 or 1-310-647-5664 to join or CLICK HERE to schedule a call!
Wishing You the Best in Investing Success,

Chuck Hughes
Editor, Trade of the Day
Have any questions? Email us at dailytrade@chuckstod.com
*Trading incurs risk and some people lose money trading.


Recent Comments