
iShares 20+ Year Treasury Bond ETF (TLT) is trending in the news and volatility expectations are high, especially around the election and the upcoming Fed meeting scheduled for November 8th. As economists and experts become increasingly worried about deficits, long-term bond volatility expectations are rising (see page 3). Volatility expectations in the stock market are increasing around earnings reports, the election, and the upcoming Fed meeting.
The good news is that we have a bunch of open straddle positions that could benefit from the increasing volatility expectations. We purchased these positions when volatility expectations were low. Now, as volatility expectations are rising, we can balance our portfolio with limited-risk, high-probability option selling strategies.


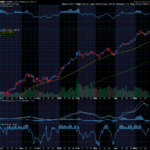
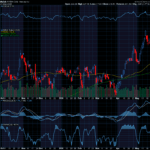
TLT is an ETF that tracks an index based on the prices of long-term US Treasury bonds. As bond yields increase, bond prices drop. You can see in the time series chart below, implied volatility (the lower green line) reached a bottom in late September. Since then, volatility expectations have rocketed higher and long-term bond prices have collapsed.

This Volatility Term Structure chart for TLT shows us the implied volatility for the at-the-money options for each expiration. This chart shows that the implied volatility for options expiring Wednesday, November 6th spikes higher. That’s because of the election. Volatility continues to increase for options expiring November 8th to above 24. That’s more than double what it was in September. The reason is due to uncertainty surrounding the Fed meeting. Because investor’s concerns about these events are valid, we will avoid selling options around those events. Instead, we’ll focus on the options expiring on November 1st.

This MDM graph compares the modeled expected distribution for future stock prices (the orange line) with the actual distribution of TLT’s share prices over the past 2 years (the blue histogram). You can see that the actual stock movement shows that TLT tends to make big moves less frequently than that the November 1st options are more November 1st options prices expect. This graph shows expensive than they should be if TLT continues to behave the way it has in the past 2 years. By focusing on these expensive options, we can take advantage of the deficit fears, without the event risks around the election and the Fed meeting.

TLT volatility expectations are high as the fear around upcoming events has investors pushing options prices higher. We have a good number of open positions that can benefit from the rising volatility expectations. Now that volatility expectations are high for many assets, we have opportunities to balance our portfolio with limited-risk, high-probability strategies that can benefit from falling volatility.
If you’ve been with us for a while, you know that we prefer direction-neutral strategies with our option trading. By balancing our direction-neutral option buying strategies that benefit from rising volatility with direction-neutral option selling strategies, our portfolio becomes more volatility-neutral as well. We will talk more about this in our ODDS Online Daily Coaching session today.
To get the specific details and prices on today’s trade ideas, be sure to read today’s ODDS Online Daily Option Trade Idea.

To access Odds Online Daily and be able to see any stock you are tracking in this software, click here.
Thank you,
Don Fishback


Recent Comments