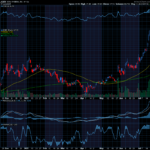
Elevance Health, Inc. (ELV) appeared on our list of compressed stocks this morning. Whenever stocks in the healthcare sector appear on this list, we get a little excited. That’s because stocks in this sector don’t need to report earnings to get the stock moving. This industry is constantly releasing information that can be catalytic for big moves in the stock price.
ELV is a health benefits provider. They provide service under Anthem Blue Cross Blue Shield, Wellpoint, & Carelon. These are brand names of insurance providers you’re probability familiar with. You might also know that there are significant similarities between options and insurance. But what really gets us excited is ELV’s solid history of making big moves after a compression signal. Its connection to options via insurance is a perk.
From an options trader’s perspective, ELV’s stock is compressed. This stock has a history of making big moves shortly after a compression signal. You can see this fact in the charts below. On top of that, volatility expectations are low relative to the way the stock has behaved over the last 4 years (see page 4). Those two facts, make ELV ripe for an option buying opportunity.

This Volatility Term Structure for ELV shows us the implied volatility of options for the at-the-money options for each expiration. To learn more about Volatility Term Structure, click here. This term structure is quite flat. The highest point in the graph is for the August monthly expiration. That high value is 25.29%. The lowest value is for the September expiration. This is the expiration we are interested in. Its value is only 21.98%. All other expirations have values between 25.29 and 21.98.


This MDM graph compares the modeled expectations of current options prices (the orange line) to the actual movement of ELV’s stock price over the past year. You can see that the actual behavior (the blue histogram) shows us that ELV made big moves more frequently than modeled options prices currently expect. That tells us that ELV options are less expensive than they should be relative to the stock’s actual behavior. That means we can buy options cheaply for the September monthly expiration.

This Volatility Cone for shows us the implied volatility of options each term compared to the average historical volatility (the blue line) of ELV options at each term. To learn more about the Volatility Cone, click here. It also shows the high and the low historical volatility for each term. This graph confirms that volatility expectations at each term are below the 4-year historical average.

ELV’s stock price is compressed with a history of making big moves after a compression signal. Volatility expectations are low relative to past stock behavior. This stock is in an industry that often has catalytic events that cause big moves in the stock price. This is an option buying opportunity.
To get the specific details and prices on today’s trade ideas, be sure to read today’s ODDS Online Daily Option Trade Idea.

To access Odds Online Daily and be able to see any stock you are tracking in this software, click here.
Thank you,
Don Fishback


Recent Comments