
One top Tech stock that is a frequent member of my ‘Buy’ list has been putting together quite an impressive trend of late. Coming out of the April lows, this stock quickly began making a clear series of higher highs and higher lows, the exact kind of pattern that I am seeking in a stock. Shortly thereafter several of my key technical ‘Buy’ indicators triggered, signaling that it was time to get serious about this stock’s trend. Recently, this company reported a blowout earnings quarter, and this has TURBO-CHARGED the stock’s move higher. In fact, since one of my ‘Buy’ signals recently triggered, the stock itself is up almost 30% in just a month.
The company that I am referring to is Oracle Corp., symbol: (ORCL). Oracle’s business is largely related to offering cloud computing services and infrastructure to various companies. Their compute capacity has served as a critical piece to the puzzle of the A.I. computing buildout as many companies are desperate for any compute capacity that they can get their hands on. This of course is evidenced by the recent phenomenal quarter of earnings that I previously mentioned. As Oracle is flexing its muscles in the quarterly results, this strength is now translating to strong price action and the technicals too. Let’s hop into the chart for ORCL to see what exactly it is telling us.
🚀Recently, our WPO Newsletter gave members a trade opportunity that posted a 148.9% gain in just over two weeks’ time! Now I cannot promise that you’ll win every trade… But I can promise you that this is one great opportunity. Want to receive the next WPO trade? CLICK HERE to sign up and have the next alert delivered to your inbox!🚀

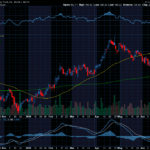
Above is a daily price chart for ORCL and the lower study that I’ve included is a MACD study. This MACD study is one of my favorite gauges to measure a stock’s momentum during the midst of a breakout. Of course, looking at the price action, anyone can see that ORCL is in a clear uptrend. But where the MACD chart becomes helpful is to verify that the stock still has a sustained thrust of momentum underlying that trend. In the chart we can see our MACD line trading above the 18-day EMA, which signals that the stock still does have significant short-term momentum to the upside. When I see a sign like this, it helps to confirm that I have found a strong candidate for a trade.
For a stock like ORCL that has experienced a good bit of price volatility lately and the options are likely carrying a little extra premium, I generally would look to trade a stock like this using my call debit spread strategy. While ORCL does have confirmed momentum still to the upside and will likely continue to trade higher in the medium term, I still would like to have a bit of downside protection built into my trade just in the event ORCL shares retrace a bit further before ultimately resuming the current uptrend. At current market prices, there is an ITM call debit spread for ORCL that offers a profit potential of 63.9% and better yet, the stock could actually drop by 10% come option expiration and the spread would be on track to realize its full profit potential. When thoughtfully constructing an options trade such as this example, it can help to give a trade a much higher probability of a successful outcome. This is exactly what I look to do by following my time-tested options strategies.
Wishing You the Best in Investing Success,

Chuck Hughes
Editor, Trade of the Day
Have any questions? Email us at dailytrade@chuckstod.com
*Trading incurs risk and some people lose money trading.


Recent Comments