
Is it time to panic? The market got spooked by a resumption of trade war concerns over rare earth elements, and with a ~3% drop in the market this past Friday, a possible major liquidation and/or repeat of the market’s reaction to trade issues in March and April seemed to be back on the table.
But then, it just stopped. Monday was bullish. Tuesday re-tested the lows only to finish the day roughly unchanged, and the dip-buyers seem to be in control once again.
So, do I ignore the risk of downside? Certainly not. Can I define my risk by implementing a trade with options after finding stocks that appear less prone to downside at this time? Absolutely! And to find those names, I use the AI-powered Forecast Toolbox!
I once again ran the screener. I looked for names with a strong forecasted price pattern. I cross-checked for names that have strong support levels that are holding, and once again, I found a company that I think makes a lot of sense here.
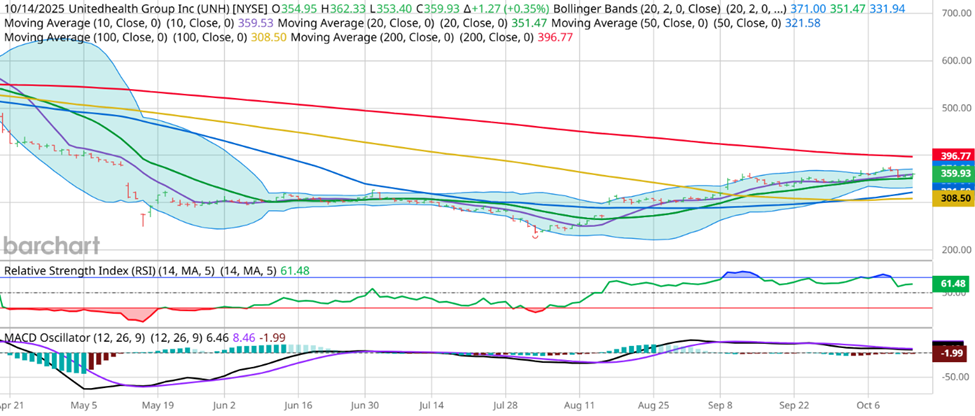
Ever since Warren Buffett announced that it was a great investment and that he had put about $1.6 billion dollars into his equity position, UNH has seen a very strong floor while continuing to grind higher:
Along with this, UNH has a strong forecast from the Forecast Toolbox:
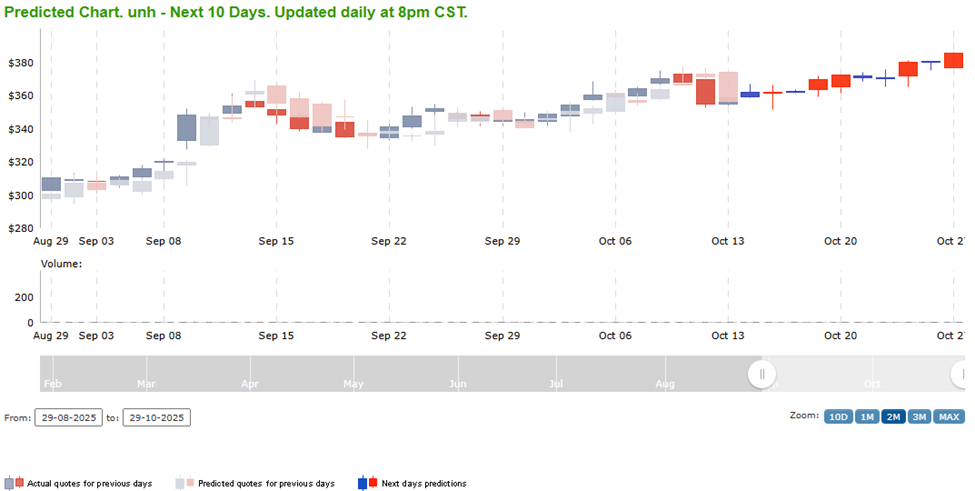

All that’s left is how to structure the trade. Because of the market uncertainty, options are expensive. I need a big move for a long call position to pay off, and that’s simply not what I’m seeing from either my technical analysis or the Forecast Toolbox. But what I do see here is more confirmation of limited downside, and that is the type of setup that I turn immediately to put credit spreads, where I sell a put option and define my risk by simultaneously buying a lower strike put option with the same expiration date. In this case, $350 looks like a strong floor – it’s lower than the projected ranges for the next 2 weeks in the Toolbox and it’s below the 20-Day Moving Average which has continually provided support on dips.
With all of this in mind, I can execute a trade via the October 24th $350/$347.5 put credit spread, currently priced at $0.66. The max value of this spread is $2.50, so my risk in this case is $1.84. If the 20-Day Moving Average holds and the low of the expected range of the toolbox is right, that’s a potential 36% return on risk in 10 days. That’s a great return, and as a reminder, longevity in trading is not based upon a get-rich-quick scheme with expectations of 10,000% returns on individual trades. By structuring a high return trade that has a strong expected value with a repeatable process, I can compound returns and significantly outperform the market. Using my trading process, this looks like a great opportunity to define risk via options in a name that has been going up but doesn’t have to keep going up for me to make money. Rather, I need the stock to simply not go down $9 or more in the next 1.5 weeks, and that’s what smart trading looks like to me.
If you’d like to get your hands on the Stock Forecast Toolbox and see what it can do for you, you can access a free trial HERE.
And if you have any questions, never hesitate to reach out.
Keith Harwood
Keith@OptionHotline.com


Recent Comments