by Ellie Taft
Traders rely on moving averages to gain perspective on the central trend. Bollinger Bnads, developed in the mid-80s by John Bollinger, is an enhanced average indicator.
A Simple Moving Average (SMA) is just what the name implies. The average price over a specified period of time. For a 22-day simple moving average you’d plot the average closing price for the previous 22 days.
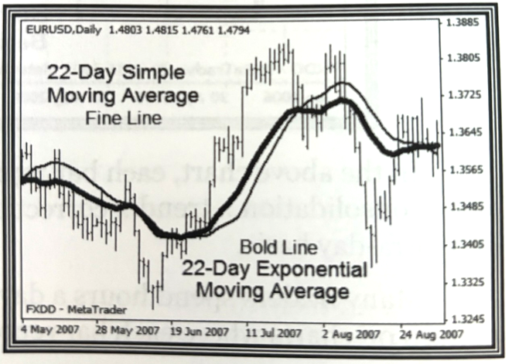
An Exponential Moving Average (EMA) give greater weight to recent data points and less to older data points.
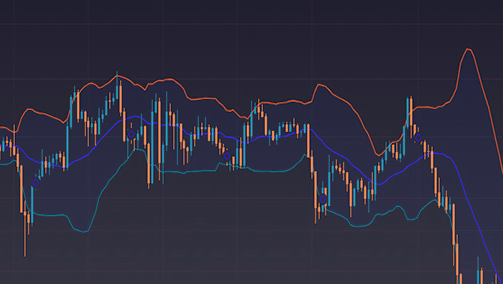
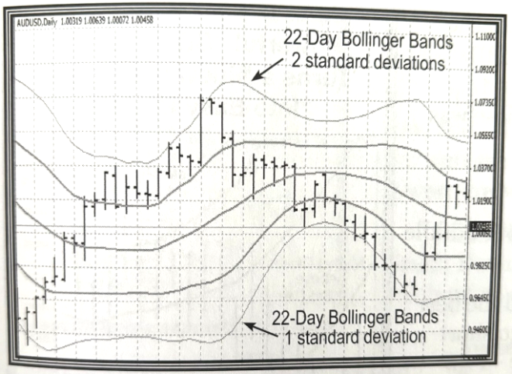
Bollinger Bands consist of an EMA centerline, bracketed above and below with Standard Deviation lines to indicate support and resistance. In other words, this indicator shows the average trading range.

Bollinger Bands are built into most charting packages, and require two parameters: Length of Time and Standard Deviation. The standard length of time is 20 bars. But a setting of 22 seems to work a little better, so that’s I use. The typical Standard Deviation is =/-2… but I also add a second set of Bollinger Bands set to +/-1 Standard Deviation.
See how the Bollinger Bands brign instant clarity to the picture?


Recent Comments