
by Keith Cotterill
In the commodity Futures market a picture could actually be worth thousands of pounds in the right hands!
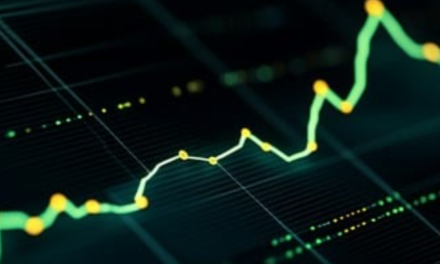
Price Charts are essential for gaining a trading edge in the Futures market. If you were to trade just using the prices listed in the financial press, it would be impossible (unless you are blessed with some super photographic memory) to work out what is happening in the market.
By using charts in partnership with the Trading Exchange Strategy we can directly identify those specific points in time when we should be LONG (buying contracts) or SHORT (selling contracts). So our aim, when using price charts, is to construct an accurate PICTURE of where the market has been, where it is now and, by applying strict criteria, where it is likely to move in the future.
With this knowledge we can move in and out of the market with confidence.
Our analysis will refer directly to the price action and the volume in the market – that is the hourly, daily, weekly, monthly, even yearly (depending on which time scale you use) sentiments of the market and how this affects prices.
By pinpointing exactly where and when the professional money is moving, we have the best trading indicator of any, to the direction of the market. Knowing when it is about to change from long to short, and vice versa, will give you an explicit and objective reason to do the same.
Before we continue let me say that there’s absolutely nothing abstract, complex or theoretical about using price charts. Whatever you may already know about technical analysis just put it to one side for a moment. Our chart analysis looks at price action in purely visual terms – not complex equations or algebra.
Ultimately, all we are interested in is when certain combinations of special signals are present and when they are absent. Each signal reveals what the professional money is doing in the market and how the professional traders try to lure inexperienced traders to buy and sell contracts at the wrong time. By understanding how the professionals do this, and how to spot this kind of activity through your charts, the risk of moving against the true trend of the market will be dramatically diminished.
The market is never wrong.
Always remember that. Once you are familiar with the specific signals to look out for you’ll achieve something few private traders have; and undeniable indication of which way the market (price) is moving and for what reasons. Equally it means that if, for whatever reason, you are active in the market at the wrong time, the signals can provide you with a clear warning that it is time to change your position.
Charts and specific individual price bars provide you with a direct and objective view of what is really happening. By thoroughly understanding and trusting the signals, you can dispense with any last vestige of guesswork, gambling or even worse ‘wishful thinking’ and squarely face the MARKET FACTS as they are.
How to read the music of the markets.
Think of a price chart as a sheet of music. A single note by itself means nothing. But play all the notes before and after and you recognize the underlying structure of the music – the melody, the rhythm and the changes.
As a song has choruses and versus, so too do charts in a way. Recognizable patterns are repeated. Changes are heralded by explicit signs. As you become used to ‘reading’ the market in chart form, you will first begin to notice that prices never move in a straight line, but will tend to move in trends. If you can move successfully with the trend then your trades will on the whole be successful and take care of themselves. It is our task to recognize the turning points in the market from one major trend to another.
In any market you will notice that prices usually move in a specific direction, either up or down. However, there are periods when a market will move sideways, apparently trendless. This is sometimes referred to as congestion. These sideways movements are often nothing more than a lull or pause in an existing trend.
Put simply, a trend is the direction a market is heading. Treat the trend as your friend. It is not trying to mislead you in any way. The trend is helpful for gauging the potential time span of our trading opportunities. By moving successfully with the trend, our positions will ultimately become profitable.
So, broadly speaking, there are only two trends of interest to us:
An UPTREND (prices rising) is bullish. To trade an uptrend successfully you need to be long – that is you will be BUYING contracts. An uptrend is easily recognized by a series of rising peaks moving in an upwards direction.
A DOWNTREND is simply the mirror image of an uptrend. It is bearish and as a trader you should be short (SELLING contract) on the market. It is signaled by a series of declining peaks and troughs.


Recent Comments