
The price movement on this chart remains in a powerful long-term uptrend, with the weekly 3-Line Break chart continuing to print higher highs and higher lows. After recovering from the April pullback, small-cap stocks have regained leadership, pushing the ETF to fresh all-time highs near $300.
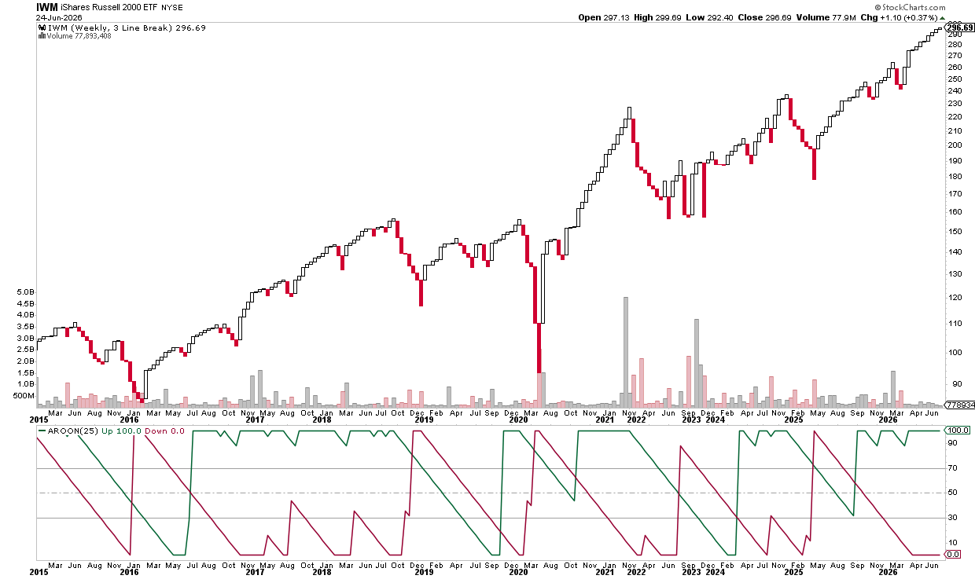
The Aroon indicator confirms IWM’s strong trend strength, with Aroon Up at 100 and Aroon Down at 0, signaling that buyers remain firmly in control. While the rally has become extended and could be vulnerable to short-term profit taking, the primary trend remains bullish. As long as IWM holds above recent breakout levels, the path of least resistance continues to favor higher prices.
Wishing you the best,
Wendy


Recent Comments