
While the market may seem like it is thrashing randomly, it is actually showing a repeating and potentially revealing pattern.
Many times as traders we want things to confirm our expectations. That can often force us to rush the true pattern and misread it. If you back up a little and look at the S&P since the beginning of the year it is starting to reveal its rhythm. If :shave and a haircut” is the most predictable rhythm, this is a bit more like a jazz riff. But, when you can see it, it will help you spot the next downbeat and set up a potentially lucrative trade. Take a look:
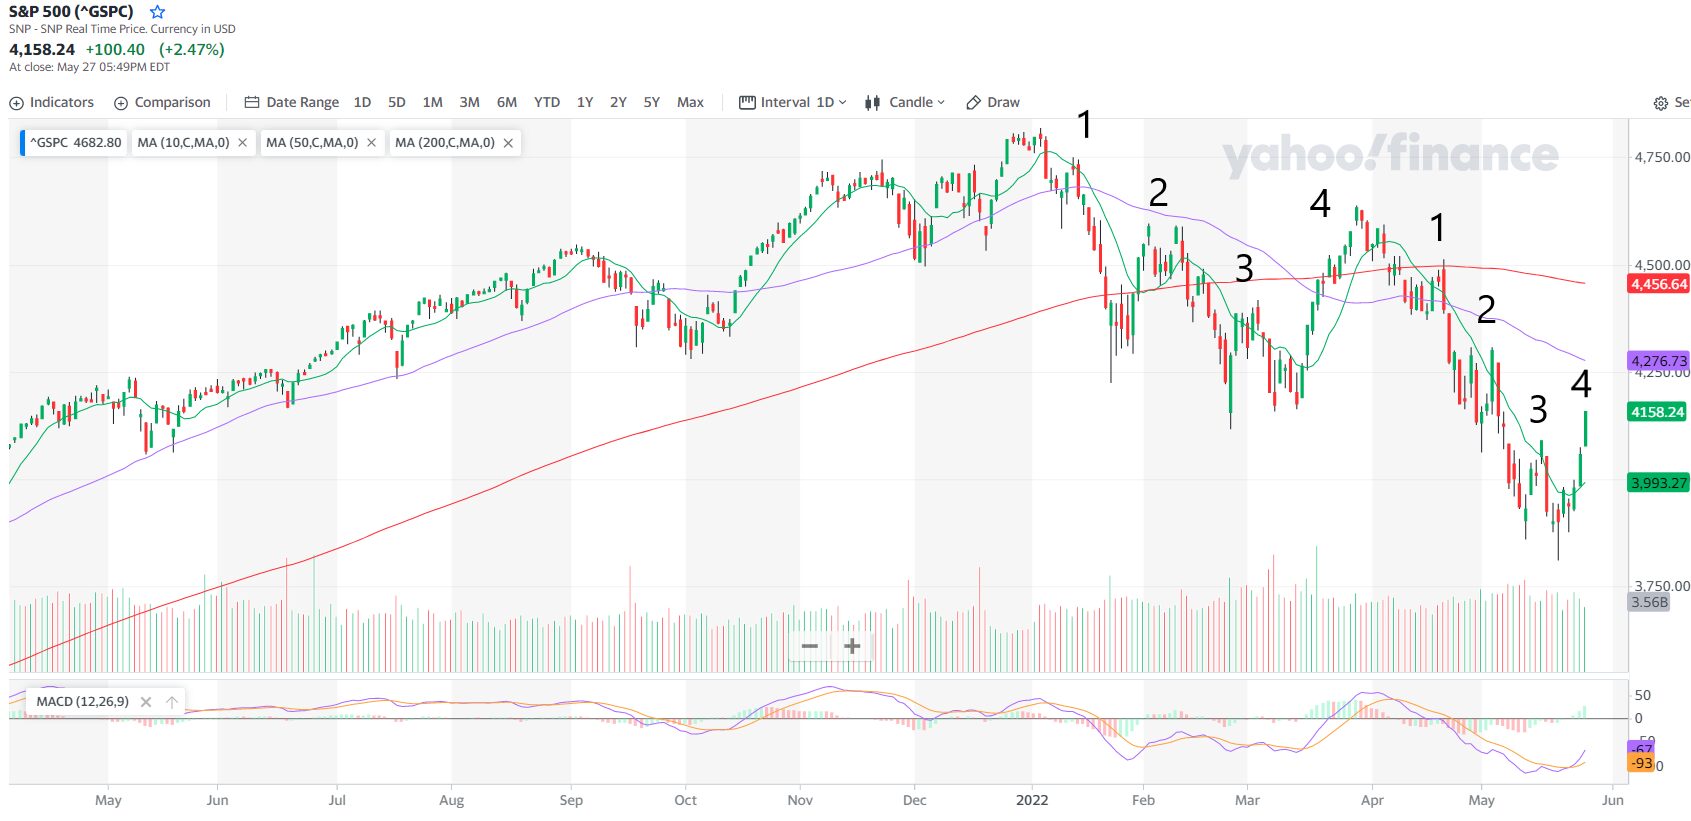
The 1 on the chart shows the beginning of a drop. You see it test the 10 day and then fail to continue the drop. The 2 is a double top that tests a key resistance point and fails again. 3 is another test of the 10 day that doesn’t make it. Then 4 is the strong bounce that goes all the way up to the 200 day. Right now we are on a path to get to the 50 which would be the next target. We also see some strength in the MACD as it curves up and spreads apart.
When you can spot these patterns, the advantage can be huge. Lee Gettess has been tracking some of the most lucrative patterns in the market. His momentum guide has helped traders like you use those patterns to increase the likelihood of wins exponentially. Be sure to grab it here.
Keep learning and trade wisely,
John Boyer
Editor
Market Wealth Daily


Recent Comments