
Dear Reader,
Yesterday, we looked at a Daily Price Chart of EXACT Sciences Corp., noting that the stock has been making a series of higher highs and higher lows.
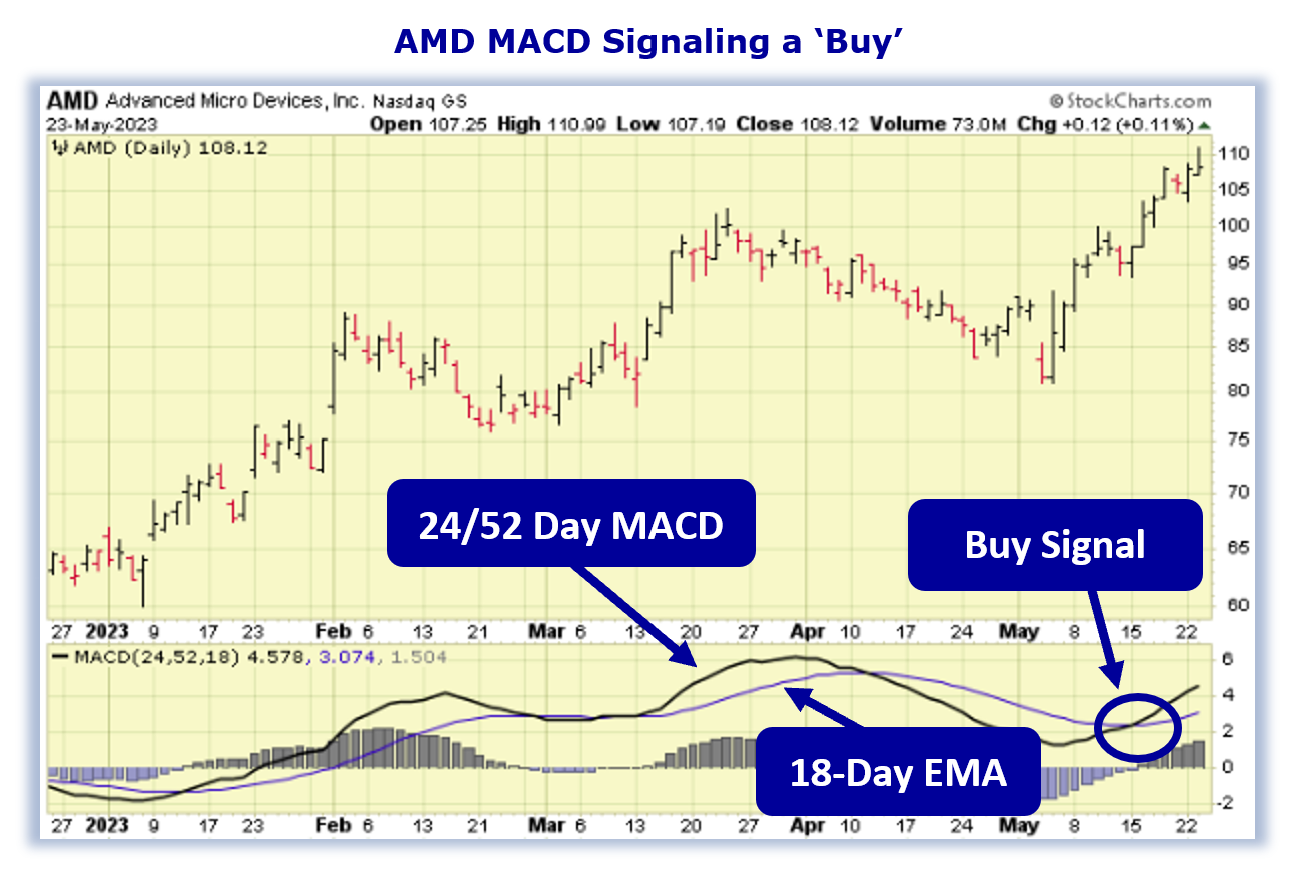
For today’s Trade of the Day e-letter we will be looking at a Moving Average Convergence/ Divergence (MACD) chart for Advanced Micro Devices, Inc. stock symbol: AMD.
Before breaking down AMD’s MACD chart let’s first review what products and services the company offers.
Advanced Micro Devices, Inc. operates as a semiconductor company worldwide. It operates in four segments: Data Center, Client, Gaming, and Embedded segments. The company offers x86 microprocessors and graphics processing units as an accelerated processing unit, chipsets, data center, and professional GPUs; and embedded processors, and semi-custom system-on-chip products, microprocessor and SoC development services and technology, data processing unites, field programmable gate arrays, and adaptive SoC products.
MACD Indicator confirms Price Momentum
The AMD daily price chart below shows that AMD is in a price uptrend as the 24/52 day MACD line (black line) is above the 18-Day EMA (purple line). The Moving Average Convergence/ Divergence chart is shown below the daily price chart.
MACD uses moving averages to create a momentum indicator by subtracting the longer-term moving average from the shorter-term moving average. The MACD is calculated by subtracting a stock’s longer term 52-Day Exponential Moving Average (EMA) from its shorter term 24-Day EMA. This creates the MACD line.
MACD ‘Buy’ Signal
The 18-Day EMA line functions as a buy/sell ‘trigger’. When the 24/52 Day MACD line crosses above the 18-Day EMA line it indicates positive momentum and higher prices for the stock. When the 24/52 Day MACD lines crosses below the 18-Day EMA it indicates negative momentum and lower prices for the stock. MACD is more of a leading indicator than a moving average cross over which tends to lag price movement.
MACD Histogram shows Acceleration of Momentum
Also included in a MACD chart is the histogram bar graph. This portion of the chart helps to illustrate the distance between the 24/52 Day MACD and the 18-Day EMA.
When a crossover initially occurs, the histogram’s bar will be near flat as the two indicator lines have converged. As the lines begin to separate, the bars grow in height, indicating a widening gap and acceleration for the stock’s momentum. When the histogram’s bars begin to shrink this indicates a narrowing of the gap between the 24/52 Day MACD and the 18-Day EMA and a slowing of the stock’s momentum. When the gap between the two indicators begins to narrow, this typically indicates a crossover of the indicator lines could happen soon.
Buy AMD Stock
As long as the 24/52 Day MACD line remains above the 18-Day EMA, the stock is more likely to keep trading at new highs in the coming days and weeks.
Since AMD’s bullish run is likely to continue, the stock should be purchased.
Our initial price target for AMD stock is 113.50 per share.
Profit if AMD is Up, Down or Flat
Now, since AMD’s 24/52 Day MACD is trading above the 18-Day EMA and will likely rally from here, let’s use the Hughes Optioneering calculator to look at the potential returns for an AMD call option spread.
The Call Option Spread Calculator will calculate the profit/loss potential for a call option spread based on the price change of the underlying stock/ETF at option expiration in this example from a 10.0% increase to a 10.0% decrease in AMD stock at option expiration.
The goal of this example is to demonstrate the ‘built in’ profit potential for option spreads and the ability of spreads to profit if the underlying stock is up, down or flat at option expiration. Out of fairness to our paid option service subscribers we don’t list the option strike prices used in the profit/loss calculation.
The prices and returns represented below were calculated based on the current stock and option pricing for AMD on 5/23/2023 before commissions.
Built in Profit Potential
For this option spread, the calculator analysis below reveals the cost of the spread is $320 (circled). The maximum risk for an option spread is the cost of the spread.
The analysis reveals that if AMD stock is flat or up at all at expiration the spread will realize a 56.3% return (circled).
And if AMD stock decreases 10.0% at option expiration, the option spread would make a 56.3% return (circled).
Due to option pricing characteristics, this option spread has a ‘built in’ 56.3% profit potential when the trade was identified*.
Option spread trades can result in a higher percentage of winning trades compared to a directional option trade if you can profit when the underlying stock/ETF is up, down or flat.
A higher percentage of winning trades can give you the discipline needed to become a successful trader.
The Hughes Optioneering Team is here to help you identify profit opportunities just like this one.

Interested in accessing the Optioneering Calculators? Join one of Chuck’s Trading Services for unlimited access! The Optioneering Team has option calculators for six different option strategies that allow you to calculate the profit potential for an option trade before you take the trade.
Trade High Priced Stocks for $350 With Less Risk
One of the big advantages to trading option spreads is that spreads allow you to trade high price stocks like Amazon, Google, or Netflix for as little as $350. With an option spread you can control 100 shares of Netflix for $350. If you were to purchase 100 shares of Netflix at current prices it would cost about $35,000. With the stock purchase you are risking $35,000 but with a Netflix option spread that costs $350 your maximum risk is $350 so your dollar risk is lower with option spreads compared to stock purchases.
Chuck’s $3,000 Trading Scholarship
I don’t want you to miss a single opportunity to potentially reach your goals. That’s why I’d like to offer you a scholarship of the full $3,000 Enrollment Fee of my exclusive Inner Circle Trading Service**.
I want you to follow in my footsteps for the opportunity to succeed beyond your wildest dreams, so please call Brad in my office at 1-866-661-5664 or 1-310-647-5664 and get started today!
You can also CLICK HERE to schedule a call now!
Wishing You the Best in Investing Success,

Chuck Hughes
Editor, Trade of the Day
Have any questions? Email us at dailytrade@chuckstod.com
*Trading incurs risk and some people lose money trading.
**Inner Circle Trading Service program provides training package and specific trade signals for one year. The first 10 people to sign up each day this offer is valid, will get a waiver of the standard fee, which is the price charged to anyone signing up after the first 10 people per day.


Recent Comments