
For today’s potential Trade of the Day, we will be looking at American International Group, Inc. (AIG).
Before analyzing AIG’s chart, let’s take a closer look at the company and its services. American International Group, Inc. offers insurance products for commercial, institutional, and individual customers in North America and internationally.
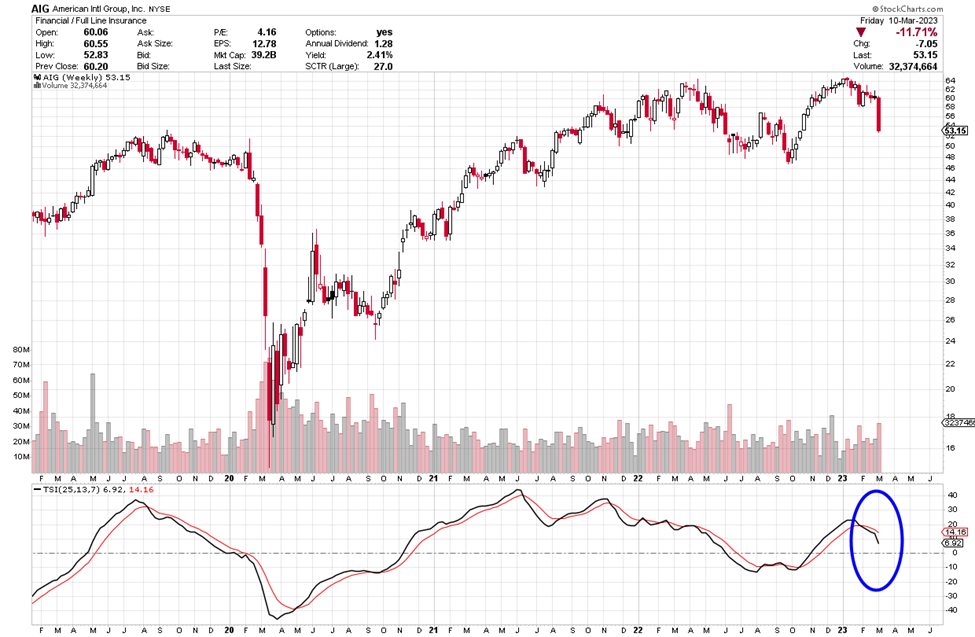
Each candle on the weekly chart represents price movement over a 5-day (week) period. The indicator at the bottom of the chart is a True Strength Indicator (TSI). The description coming up next explains how to use the TSI.
A cross up through the TSI red signal is bullish, in that it is suggesting price has gone from bearish to bullish. A cross down through the red line suggests price is bearish. If you want to learn more about the TSI, you can read through the short section below, or you can scroll down to the alert signal.
True Strength Indicator
Stockcharts.com provides a great definition of the True Strength Index (TSI), which is an oscillator that fluctuates between positive and negative territory. As with many momentum oscillators, the centerline defines the overall bias. The bulls have the momentum edge when TSI is positive, and the bears have the edge when it’s negative.
As with PPO, a signal line can be applied to identify upturns and downturns. Signal line crossovers are, however, quite frequent and require further filtering with other techniques. Chart readers can also look for bullish and bearish divergences to anticipate trend reversals; however, keep in mind that divergences can be misleading in a strong trend. TSI is somewhat unique because it tracks the underlying price quite well. In other words, the oscillator can capture a sustained move in one direction or the other. The peaks and troughs in the oscillator often match the peaks and troughs in price. In this regard, chart readers can draw trend lines and mark support/resistance levels using TSI. Line breaks as well as line crosses can then be used to generate signals.

Potential AIG’s Trade:
If AIG’s price continues to move down, you could consider a Put trade. I am writing this on Sunday, if price continues to move to $53 when you receive this on Tuesday, you could consider a put option trade. We are expecting the TSI indicator to continue to head down.
AIG’s is bearish as the signal line moves closer to the 0. The short-term target is $50 and then lower.
Check Out How an Option Trade Could Pay Out Big Time
These examples are provided to show how options work and the advantages they offer. To buy shares of AIG’s stock today, it would cost approximately $53.15 per share. You would wait until it found a bottom to buy stock.
Option trading offers the potential of a lower initial investment and higher percentage gain. It is like renting stock versus buying out right. Let’s take a look.
If you bought one Put option contract covering 100 shares of AIG’s stock with a April 21st expiration date for the 50 strike, the premium would be approximately $1.60 per share, or a total of $160 for the contract of 100 shares. If price fell the expected $3 over the next few weeks, the premium would likely increase approximately $1.50 to $3.10. This is a gain of 94% profit. That would be a nice trade over a short period of time!
It is exciting to make money if price rises or falls.
I want to remind you that you can sell to close and take profit any time along the line before the expiration date. You don’t have to hold the contract until expiration.
Options often offer a smaller overall investment, covering more shares of stock and potential for greater profits. This is like renting stocks versus having to pay full price to buy.
For updates on previous potential trades we have discussed, scroll to the bottom of this message.
I love to trade, and I love to teach. It is my thing. I am truly thankful for you and your efforts.
Being thankful is one of the strongest and most transforming states of being. It shifts your perspective from lack to abundance and allows you to focus on the good in your life, which in turn pulls more blessings into your reality.
I send you wishes for the very best,
Wendy
PS-I have just released a new book that show how to apply all of the the lessons and positive thinking that has allowed me and thousands of students like you to transform their life. What has helped empower students to become great traders can also create happiness and fulfillment in the other aspects of your life. Check it out now on Amazon here. Wendy’s New Book
Past potential trade update:
Last week talked about buying SOFI Calls. It did not reach our target entry price. No trade would be taken.


Recent Comments