
For today’s potential Trade of the Day, we will be looking at APA Corporation. (APA).
Here is what you will access below:
-A way to trade skyrocketing energy prices that benefits as cost at the pump goes up,
-The key to a powerful indicator effective at spotting upturns and downturns,
–Where to get ahead of investors scrambling in this chaotic market.
-A trade with the potential to produce a quick gain.
Before analyzing APA’s chart, let’s take a closer look at the company and its services.
APA Corporation, through its subsidiaries, explores for, develops, and produces oil and gas properties. It has operations in the United States, Egypt, and the United Kingdom, as well as has exploration activities offshore Suriname. The company also operates gathering, processing, and transmission assets in West Texas, as well as holds ownership in four Permian-to-Gulf Coast pipelines. APA Corporation was founded in 1954 and is based in Houston, Texas.
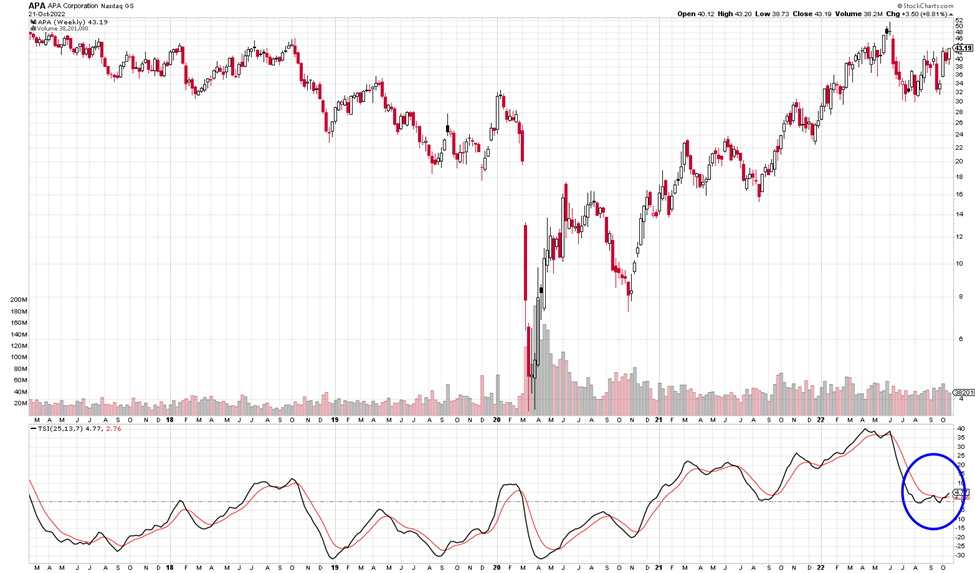
Each candle on the weekly chart represents price movement over a 5-day (week) period. The indicator at the bottom of the chart is a True Strength Indicator (TSI). The description coming up next explains how to use the TSI.
A cross up through the TSI red signal is bullish, in that it is suggesting price has gone from bearish to bullish. A cross down through the red line suggests price is bearish. If you want to learn more about the TSI, you can read through the short section below, or you can scroll down to the alert signal.
True Strength Indicator
Stockcharts.com provides a great definition of the True Strength Index (TSI), which is an oscillator that fluctuates between positive and negative territory. As with many momentum oscillators, the centerline defines the overall bias. The bulls have the momentum edge when TSI is positive, and the bears have the edge when it’s negative.
As with PPO, a signal line can be applied to identify upturns and downturns. Signal line crossovers are, however, quite frequent and require further filtering with other techniques. Chart readers can also look for bullish and bearish divergences to anticipate trend reversals; however, keep in mind that divergences can be misleading in a strong trend.
TSI is somewhat unique because it tracks the underlying price quite well. In other words, the oscillator can capture a sustained move in one direction or the other. The peaks and troughs in the oscillator often match the peaks and troughs in price. In this regard, chart readers can draw trend lines and mark support/resistance levels using TSI. Line breaks as well as line crosses can then be used to generate signals.

Potential APA’s Trade:
If APA’s price continues to move up, you could consider a Call trade. I am writing this on Sunday, if price continues to move to $44 when you receive this on Tuesday, you could consider a call option trade. We are expecting the TSI indicator to continue to head up.
APA’s is bullish as the signal line crosses. The short-term target is $50 and then higher.
Check Out How an Option Trade Could Pay Out Big Time
These examples are provided to show how options work and the advantages they offer. To buy shares of APA stock today, it would cost approximately $43.19 per share. If price rose to $50 you would make about $6.81 per share.
Option trading offers the potential of a lower initial investment and higher percentage gain. It is like renting stock versus buying out right. Let’s take a look.
If you bought one Call option contract covering 100 shares of APA’s stock with a Nov 18th expiration date for the 50 strike, the premium would be approximately $ .84 per share, or a total of $84 for the contract of 100 shares. If price rose the expected $4 over the next few weeks, the premium would likely increase approximately $2.00 to $2.84. This is a gain of 238% profit. That would be a nice trade over a short period of time!
It is exciting to make money if price rises or falls.
I want to remind you that you can sell to close and take profit any time along the line before the expiration date. You don’t have to hold the contract until expiration.
Options often offer a smaller overall investment, covering more shares of stock and potential for greater profits. This is like renting stocks versus having to pay full price to buy.
For updates on previous potential trades we have discussed, scroll to the bottom of this message.
I love to trade, and I love to teach. It is my thing. I am truly thankful for you and your efforts.
Being thankful is one of the strongest and most transforming states of being. It shifts your perspective from lack to abundance and allows you to focus on the good in your life, which in turn pulls more blessings into your reality.
I send you wishes for the very best,
Wendy

Past potential trade update:
Last week we discussed CRM puts. The price did not reach out target entry price. Not trade would be taken.


Thanks for the example I can use in paper trade for my first time . Im reading the book and warming up to start for real after the next rate hike next week. My question is how much time do I have to open the trade after you give the alert? And where/how can I ask the occasional question?