
Dear Reader,
Yesterday, we looked at a Daily Price Chart of Palo Alto Networks Inc. noting the stock’s 50-Day EMA is trading above the 100-Day EMA signaling a ‘Buy’.
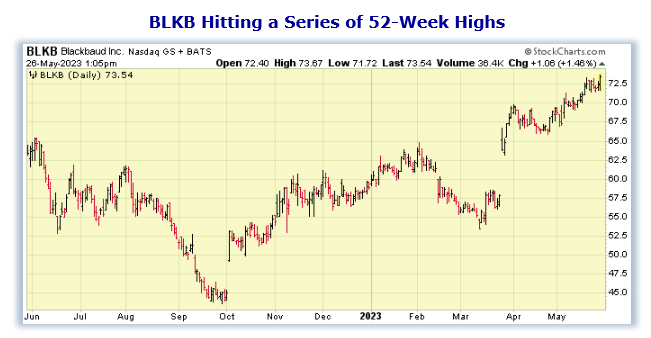
For today’s Trade of the Day we will be looking at a Daily Price chart for Blackbaud Inc. stock symbol: BLKB.
Before breaking down BLKB’s daily price chart let’s first review which products and services are offered by the company.
Blackbaud, Inc. provides cloud software solutions to higher education institutions, K12 schools, healthcare organizations, faith communities, arts and cultural organizations, foundations, companies, and individual change agents in the United States and internationally.
Now, let’s begin to break down the Daily Price chart for BLKB. Below is a Daily Price Chart with the price line displayed by an OHLC bar.
Buy BLKB Stock
The Daily Price chart above shows that BLKB stock has been hitting new 52-Week Highs regularly since early May.
Simply put, a stock does not just continually hit a series of new 52-Week Highs unless it is in a very strong bullish trend.
The Hughes Optioneering team looks for stocks that are making a series of 52-Week Highs as this is a good indicator that the stock is in a powerful uptrend.
You see, after a stock makes a series of two or more 52-Week Highs, the stock typically continues its price uptrend and should be purchased.
Our initial price target for BLKB stock is 79.50 per share.

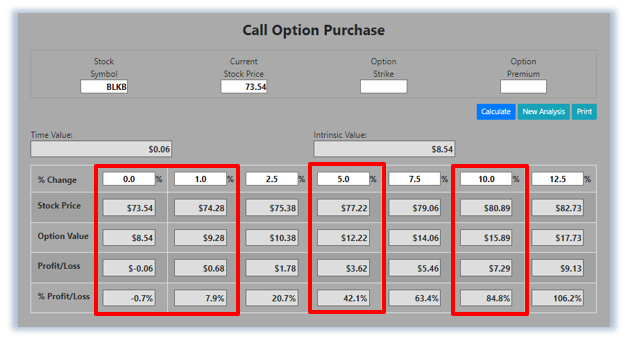
84.8% Profit Potential for BLKB Option
Now, since BLKB stock is currently making a series of new 52-Week Highs this means the stock’s bullish rally will likely continue. Let’s use the Hughes Optioneering calculator to look at the potential returns for a BLKB call option purchase.
The Call Option Calculator will calculate the profit/loss potential for a call option trade based on the price change of the underlying stock/ETF at option expiration in this example from a flat BLKB price to a 12.5% increase.
The Optioneering Team uses the 1% Rule to select an option strike price with a higher percentage of winning trades. In the following BLKB option example, we used the 1% Rule to select the BLKB option strike price but out of fairness to our paid option service subscribers we don’t list the strike price used in the profit/loss calculation.
Trade with Higher Accuracy
When you use the 1% Rule to select a BLKB in-the-money option strike price, BLKB stock only has to increase 1% for the option to breakeven and start profiting! Remember, if you purchase an at-the-money or out-of-the-money call option and the underlying stock closes flat at option expiration it will result in a 100% loss for your option trade! In this example, if BLKB stock is flat at 73.54 at option expiration, it will only result in a 0.7% loss for the BLKB option compared to a 100% loss for an at-the-money or out-of-the-money call option.
Using the 1% Rule to select an option strike price can result in a higher percentage of winning trades compared to at-the-money or out-of-the-money call options. This higher accuracy can give you the discipline needed to become a successful option trader and can help avoid 100% losses when trading options.
The goal of this example is to demonstrate the powerful profit potential available from trading options compared to stocks.
The prices and returns represented below were calculated based on the current stock and option pricing for BLKB on 5/26/2023 before commissions.
When you purchase a call option, there is no limit on the profit potential of the call if the underlying stock continues to move up in price.
For this specific call option, the calculator analysis below reveals if BLKB stock increases 5.0% at option expiration to 77.22 (circled), the call option would make 42.1% before commission.
If BLKB stock increases 10.0% at option expiration to 80.89 (circled), the call option would make 84.8% before commission and outperform the stock return more than 8 to 1*.
The leverage provided by call options allows you to maximize potential returns on bullish stocks.
The Hughes Optioneering Team is here to help you identify profit opportunities just like this one.
Interested in accessing the Optioneering Calculators? Join one of Chuck’s Trading Services for unlimited access! The Optioneering Team has option calculators for six different option strategies that allow you to calculate the profit potential for an option trade before you take the trade
Average Portfolio Return of 398.3%
Below is a screenshot of the current open trade profit opportunities from Chuck’s Weekly Option Alert Trading Service. There are currently $161,113.36 in open trade profit opportunities with an average portfolio return of 398.3% demonstrating the ability of the Optioneering Strategy to deliver substantial returns with no losing portfolios**.
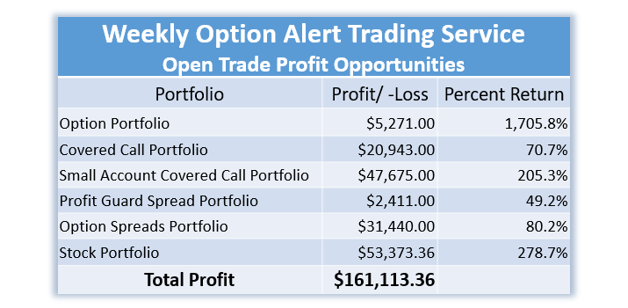
**Open trade profit results represent the open trade profit performance for the portfolio displayed on 5/26/23. Open trade profits may have increased or decreased when trades were closed out. Trading incurs risk and some people lose money trading. Past performance does not necessarily predict future results. Member profits and losses are not tracked. Profit potential is taken from results of signaled trades, not actual member results. Not all members make the trades.
Get Trade Insights Directly From Chuck
You can start getting market insights directly from 10-Time Trading Champion Chuck Hughes.
See what he’s trading and when with his exclusive Weekly Option Alert Trading Service where he will send you his hand-picked stock and option trades.
Just call Brad at 1-866-661-5664 or 1-310-647-5664 to join or CLICK HERE to schedule a call!
Wishing You the Best in Investing Success,

Chuck Hughes
Editor, Trade of the Day
Have any questions? Email us at dailytrade@chuckstod.com
*Trading incurs risk and some people lose money trading.


Recent Comments