
Dear Reader,
Yesterday, we looked at a Daily Price Chart for PulteGroup, Inc., noting that the stock’s OBV line is sloping up, validating the recent bullish trend.
For today’s Trade of the Day we will be looking at a Daily Price chart for Tractor Supply Co. stock symbol: TSCO.
Before breaking down TSCO’s daily price chart let’s first review which products and services are offered by the company.
Tractor Supply Company operates as a rural lifestyle retailer in the United States. The company offers a selection of merchandise, including equine, livestock, pet, and small animal products necessary for their health, care, growth, and containment; hardware, truck, towing, and tool products; seasonal products, such as heating products, lawn and garden items, power equipment, gifts, and toys; work/recreational clothing and footwear; and maintenance products for agricultural and rural use.
Now, let’s begin to break down the Daily Price chart for TSCO. Below is a Daily Price Chart with the price line displayed by an OHLC bar.
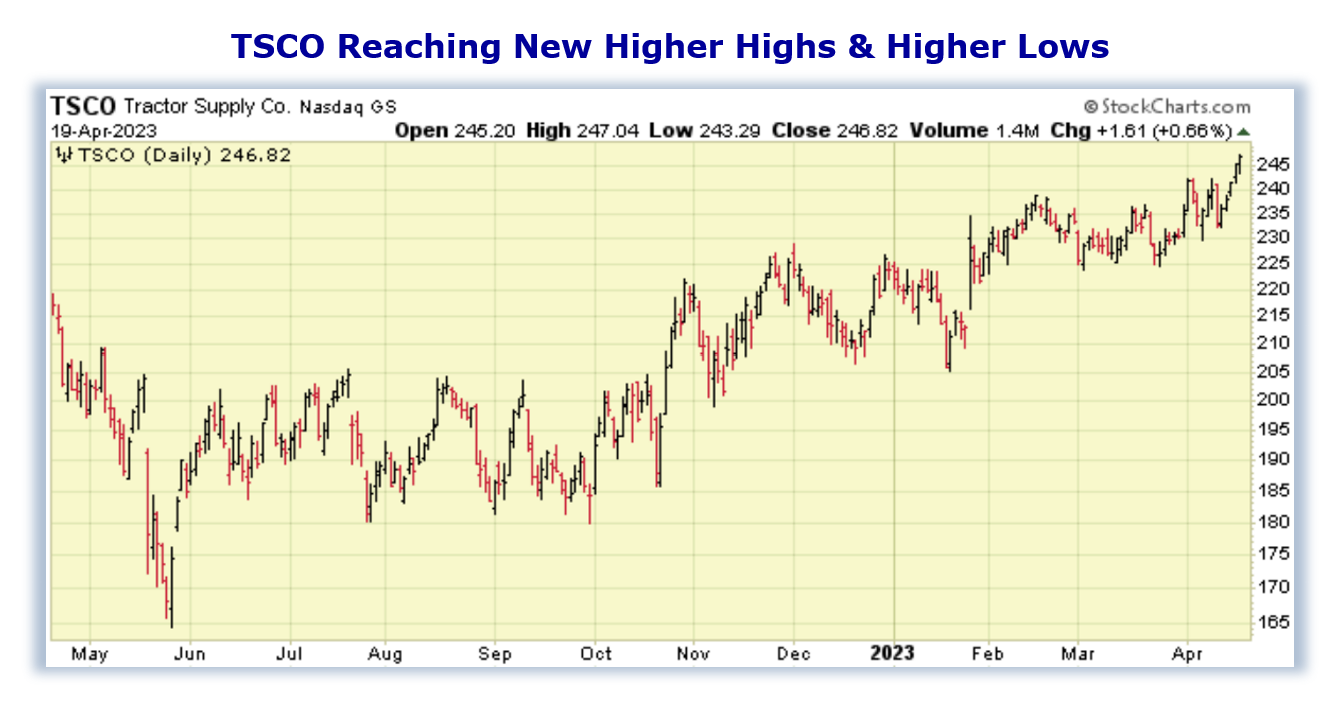
Buy TSCO Stock
The Daily Price chart above shows that TSCO stock began reaching a series of higher highs and higher lows since early-April.
This pattern of bullish trading suggests the stock will march on to a further advance.
You see, after a stock makes a series of two or more higher highs and higher lows, the stock typically continues its price up trend and should be purchased.
Our initial price target for TSCO stock is 246.82 per share.

118.4% Profit Potential for TSCO Option
Now, since TSCO stock is currently making a series of higher highs and higher lows this means the stock’s bullish rally will likely continue. Let’s use the Hughes Optioneering calculator to look at the potential returns for a TSCO call option purchase.
The Call Option Calculator will calculate the profit/loss potential for a call option trade based on the price change of the underlying stock/ETF at option expiration in this example from a flat TSCO price to a 12.5% increase.
The Optioneering Team uses the 1% Rule to select an option strike price with a higher percentage of winning trades. In the following TSCO option example, we used the 1% Rule to select the TSCO option strike price but out of fairness to our paid option service subscribers we don’t list the strike price used in the profit/loss calculation.
Trade with Higher Accuracy
When you use the 1% Rule to select a TSCO in-the-money option strike price, TSCO stock only has to increase 1% for the option to breakeven and start profiting! Remember, if you purchase an at-the-money or out-of-the-money call option and the underlying stock closes flat at option expiration it will result in a 100% loss for your option trade! In this example, if TSCO stock is flat at 246.82 at option expiration, it will only result in an 11.5% loss for the TSCO option compared to a 100% loss for an at-the-money or out-of-the-money call option.
Using the 1% Rule to select an option strike price can result in a higher percentage of winning trades compared to at-the-money or out-of-the-money call options. This higher accuracy can give you the discipline needed to become a successful option trader and can help avoid 100% losses when trading options.
The goal of this example is to demonstrate the powerful profit potential available from trading options compared to stocks.
The prices and returns represented below were calculated based on the current stock and option pricing for TSCO on 4/19/2023 before commissions.
When you purchase a call option, there is no limit on the profit potential of the call if the underlying stock continues to move up in price.
For this specific call option, the calculator analysis below reveals if TSCO stock increases 5.0% at option expiration to 259.16 (circled), the call option would make 53.5% before commission.
If TSCO stock increases 10.0% at option expiration to 271.50 (circled), the call option would make 118.4% before commission and outperform the stock return nearly 12 to 1*.
The leverage provided by call options allows you to maximize potential returns on bullish stocks.
The Hughes Optioneering Team is here to help you identify profit opportunities just like this one.

Interested in accessing the Optioneering Calculators? Join one of Chuck’s Trading Services for unlimited access! The Optioneering Team has option calculators for six different option strategies that allow you to calculate the profit potential for an option trade before you take the trade.
Get Trade Insights Directly From Chuck
You can start getting market insights directly from 10-Time Trading Champion Chuck Hughes.
See what he’s trading and when with his exclusive Inner Circle Trading Service where he will send you his hand-picked stock and option trades.
Just call Brad at 1-866-661-5664 or 1-310-647-5664 to join or CLICK HERE to schedule a call!
Wishing You the Best in Investing Success,

Chuck Hughes
Editor, Trade of the Day
Have any questions? Email us at dailytrade@chuckstod.com
*Trading incurs risk and some people lose money trading.


Recent Comments