
For today’s potential Trade of the Day, we will be looking at Caterpillar Inc. (CAT).
Below we cover:
- A powerful indicator that reveals if bull or bears are controlling a stock,
- How to control 100 shares for the cost of just 2,
- A reliable trading approach that could be the best side hustle ever.
Before analyzing CAT’s chart, let’s take a closer look at the company and its services.
Caterpillar Inc. manufactures and sells construction and mining equipment, diesel and natural gas engines, and industrial gas turbines. Its Construction Industries segment offers asphalt pavers, compactors, cold planers, feller bunchers, harvesters, motorgraders, pipelayers, road reclaimers, skidders, telehandlers, and utility vehicles; backhoe, knuckleboom, compact track, multi-terrain, skid steer, and track-type loaders; forestry and wheel excavators; and site prep and track-type tractors. The company’s Resource Industries segment provides electric rope and hydraulic shovels, draglines, rotary drills, hard rock vehicles, track-type tractors, mining trucks, longwall miners, wheel loaders, off-highway and articulated trucks, wheel tractor scrapers, wheel dozers, landfill and soil compactors, machinery components, electronics and control systems, select work tools, and hard rock continuous mining systems. The company was formerly known as Caterpillar Tractor Co. and changed its name to Caterpillar Inc. in 1986. The company was founded in 1925 and is headquartered in Deerfield, Illinois.
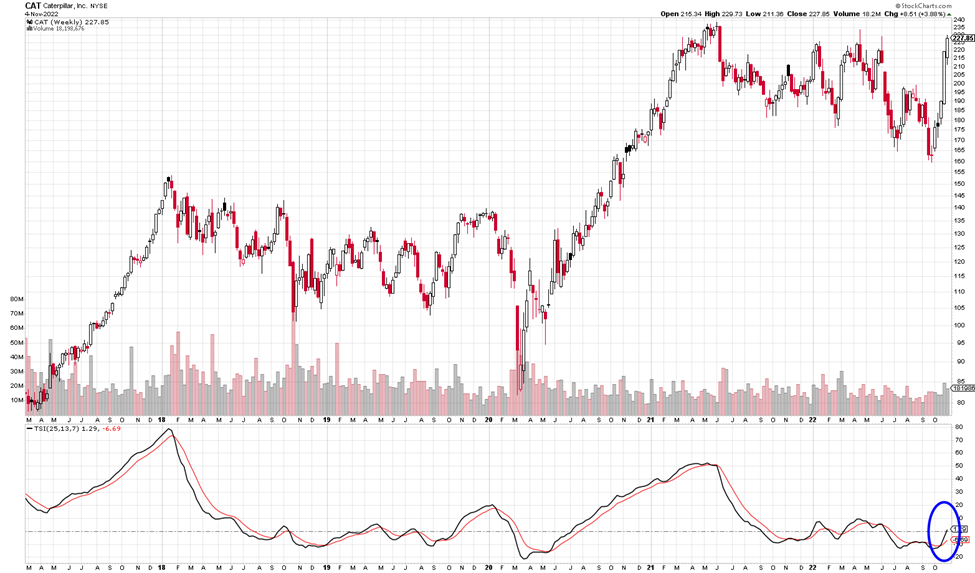
Each candle on the weekly chart represents price movement over a 5-day (week) period. The indicator at the bottom of the chart is a True Strength Indicator (TSI). The description coming up next explains how to use the TSI.
A cross up through the TSI red signal is bullish, in that it is suggesting price has gone from bearish to bullish. A cross down through the red line suggests price is bearish. If you want to learn more about the TSI, you can read through the short section below, or you can scroll down to the alert signal.
True Strength Indicator
Stockcharts.com provides a great definition of the True Strength Index (TSI), which is an oscillator that fluctuates between positive and negative territory. As with many momentum oscillators, the centerline defines the overall bias. The bulls have the momentum edge when TSI is positive, and the bears have the edge when it’s negative.
As with PPO, a signal line can be applied to identify upturns and downturns. Signal line crossovers are, however, quite frequent and require further filtering with other techniques. Chart readers can also look for bullish and bearish divergences to anticipate trend reversals; however, keep in mind that divergences can be misleading in a strong trend.
TSI is somewhat unique because it tracks the underlying price quite well. In other words, the oscillator can capture a sustained move in one direction or the other. The peaks and troughs in the oscillator often match the peaks and troughs in price. In this regard, chart readers can draw trend lines and mark support/resistance levels using TSI. Line breaks as well as line crosses can then be used to generate signals.

Potential CAT’s Trade:
If CAT’s price continues to move up, you could consider a Call trade. I am writing this on Sunday, if price continues to move to $228 when you receive this on Tuesday, you could consider a call option trade. We are expecting the TSI indicator to continue to head up.
CAT’s is bullish as the signal line crosses. The short-term target is $235 and then higher.
Check Out How an Option Trade Could Pay Out Big Time
These examples are provided to show how options work and the advantages they offer. To buy shares of CAT stock today, it would cost approximately $227.85 per share. If price rose to $228 you would make about $ .15 per share.
Option trading offers the potential of a lower initial investment and higher percentage gain. It is like renting stock versus buying out right. Let’s take a look.
If you bought one Call option contract covering 100 shares of CAT’s stock with a Nov 25th expiration date for the 235 strike, the premium would be approximately $4.00 per share, or a total of $400 for the contract of 100 shares. If price rose the expected $7 over the next few weeks, the premium would likely increase approximately $3.50 to $7.50. This is a gain of 50% profit. That would be a nice trade over a short period of time!
It is exciting to make money if price rises or falls.
I want to remind you that you can sell to close and take profit any time along the line before the expiration date. You don’t have to hold the contract until expiration.
Options often offer a smaller overall investment, covering more shares of stock and potential for greater profits. This is like renting stocks versus having to pay full price to buy.
For updates on previous potential trades we have discussed, scroll to the bottom of this message.
I love to trade, and I love to teach. It is my thing. I am truly thankful for you and your efforts.
Being thankful is one of the strongest and most transforming states of being. It shifts your perspective from lack to abundance and allows you to focus on the good in your life, which in turn pulls more blessings into your reality.
I send you wishes for the very best,
Wendy

Past potential trade update:
Last week we discussed APA. We could have bought APA 50 calls with a Nov 18th for $.47. On Nov 4th the premium was $1.57. This is a 234% profit.


Recent Comments