Keep an eye on the Volatility Index (VIX).
At the moment, it’s too calm under 17. Historically, when it’s this eerily calm and relative strength (RSI), Bollinger Bands, Full Stochastics, and Williams’ %R are this low, we’ll see an increase in volatility, and chaos in the markets. While we hope we’re wrong, we’re using history as our guide here.
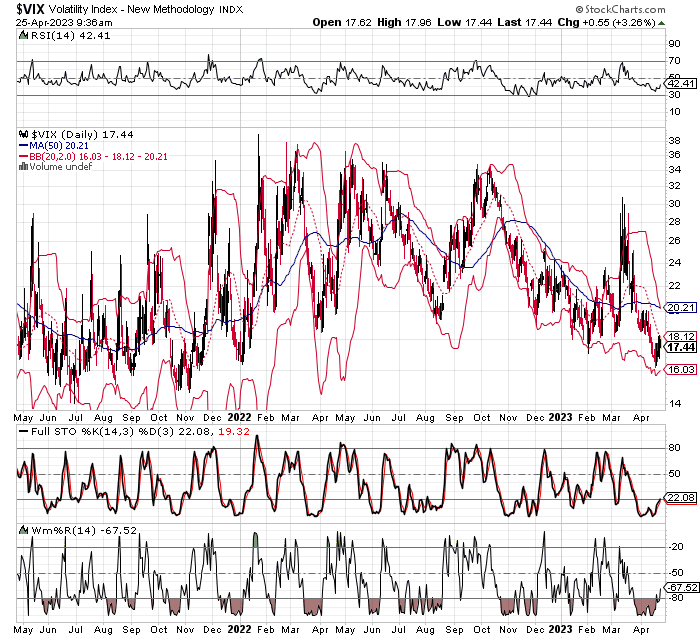

In fact, if you look at a two-year chart of the VIX with those very technical indicators, you can see just how calm it is – and how we can historically use that calm to our advantage. For one, when the VIX challenges or penetrates its lower Bollinger Band, it’s considered oversold, and begins to pivot higher shortly after. That increase in volatility often leads to downside in the major indices. Two, we can confirm the VIX is oversold with RSI at or below its 30 line. Three, we can confirm its oversold again with Full Stochastics at or near its 20-line. And four, we can confirm further with W%R at or above its 80-line.
Sincerely,
Ian Cooper


Recent Comments