
by Jea Yu
Anytime the price chart is too tight, either scale the chart to your screen or trim down the number of days of historical data. Stocks that have had a big range can end up looking too tight on the moving average charges. We usually want to have at least 200 periods total to accurately gauge the 200-period simple moving average level, but if the stock range is too large, the charts can be too tight to read. Use the scale to screen option (if applicable), or shrink the historic data.
Intraday Time Frames
The Secret Tool Unveiled: The Rifle Charts
Every single trade I make or alert now goes through this new weapon, the 5- and 1-minute Full Data (24-Hour) Rifle Charts. I give credit to CobraTrading.com and their CobraIQ platform for being instrumental in my development and testing of this weapon. I created a preformatted template of the UndergroundTrader Rifle Charts for the CobraIQ platform at CobraTrading.com specifically for my readers and their clients, so open up an account there if you are serious about pursuing the trading journey. The advantage of the full time frame data fills in many gaps and gives a more thorough picture of the setups. I also added the 5-peiord simple moving average to the 1-minute chart, which is invaluable when playing mini pups to determine to the penny where the dynamic support level is. Kudos to my friends John and Phyllis Hill for helping me add that critical mechanism.
Until I started using this tool, I didn’t think the pre- or post-market was navigable due to the lack of data and charting. This new tool has not only opened up these pathways, but allows one to optimize and filter with such pinpoint accuracy that you can literally time a breakout to the minute ahead of time. This new tool has actually allowed me to take advantage of a less traveled landscape that has yet to be super saturated with program trading, black boxes, market makers and manipulation. It has become so essential that every single trade I make must first past muster through this tool. You know the saying, “this is my rifle and this is my gun, this is for fighting and this is for fun…”? Well, this tool is my rifle.
These two charts are similar to the basic stochastic moving average charts, but with the inclusion of pre- and post-market data. Unfortunately, many systems don’t allow for a full 24-hour stock data feed, or they have inconsistent data. The best trading platform for this is the CobraIQ platform (www.cobratrading.com), bar none. I have tried to utilize the pre-market charting on all the major platforms and for one reason or another; there were just some nutty irregularities.
The chart settings are as follows:
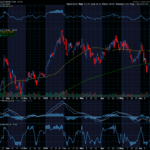
The 5-minute Chart
- Candlesticks
- 5- and 15-period simple moving averages
- Stochastics (%d slow 15, 3 or 15, 3, 5 depending on provider
- Bollinger bands (20-period, 2 standard deviations) which contain an upper or lower envelope and a 20-period moving average
- Volume bars
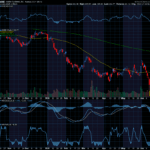
The 1-Minute Chart
- Candlesticks
- 5-period moving average
- 50- and 200-period simple moving averages
- Stochastics (% d slow 15, 3 or 15, 3, 5 depending on number)
- Bollinger bands (20-period, 2 standard deviations) which contain an upper or lower envelope and a 20-period moving average
These charts give the best edge when it comes to pre-market trading on stocks with volume. The most applicable stocks are gappers and dumpers, or the high volume leader stocks when the futures are gapping up or down strong. As long as there is some volume, these charts are great.


Recent Comments