
Dear Reader,
Yesterday, we looked at a Daily Price Chart for Intuitive Surgical, Inc. noting that the stock’s OBV line is sloping up, validating the recent bullish trend.
For today’s Trade of the Day e-letter we will be looking at a daily price chart for KB Home stock symbol: KBH.
Before breaking down KBH’s daily chart let’s first review what products and services the company offers.
KB Home operates as a homebuilding company in the United States. It operates through four segments: West Coast, Southwest, Central, and Southeast. It builds and sells various homes, including attached and detached single-family residential homes, townhomes, and condominiums primarily for first-time, first move-up, second move-up, and active adult homebuyers.
Now, let’s begin to break down the Daily Price chart for KBH stock.
Below is a Daily Price chart with the 50-Day EMA and 100-Day EMA for KBH.

50-Day EMA and 100-Day EMA ‘Buy’ Signal
The 50-Day Exponential Moving Average (EMA) and 100-Day EMA are moving average indicator lines that can provide buy and sell signals when used together. When the shorter-term 50-Day EMA crosses above or below the longer-term 100-Day EMA, this provides either a buy or sell signal depending on which direction the stock price is moving.
- 50-Day EMA line Above 100-Day EMA = Price Uptrend = Buy signal
- 50 Day EMA line Below 100-Day EMA = Price Downtrend = Sell signal
When the 50-Day EMA (blue line) crosses above the 100-Day EMA (red line) this indicates that the stock’s buying pressure has begun to outweigh the selling pressure signaling a ‘buy’ signal. When the 50-Day EMA crosses below the 100-Day EMA this indicates that the selling pressure has begun to outweigh the buying pressure signaling a ‘sell’ signal.
Buy KBH Stock
As the chart shows, on December 13th, the KBH 50-Day EMA, crossed above the 100-Day EMA.
This crossover indicated the buying pressure for KBH stock exceeded the selling pressure. For this kind of crossover to occur, a stock has to be in a strong bullish trend.
Now, as you can see, the 50-Day EMA is still above the 100-Day EMA meaning the ‘buy’ signal is still in play.
As long as the 50-Day EMA remains above the 100-Day EMA, the stock is more likely to keep trading at new highs and should be purchased.
Our initial price target for KBH stock is 52.50 per share.

127.7% Profit Potential for KBH Option
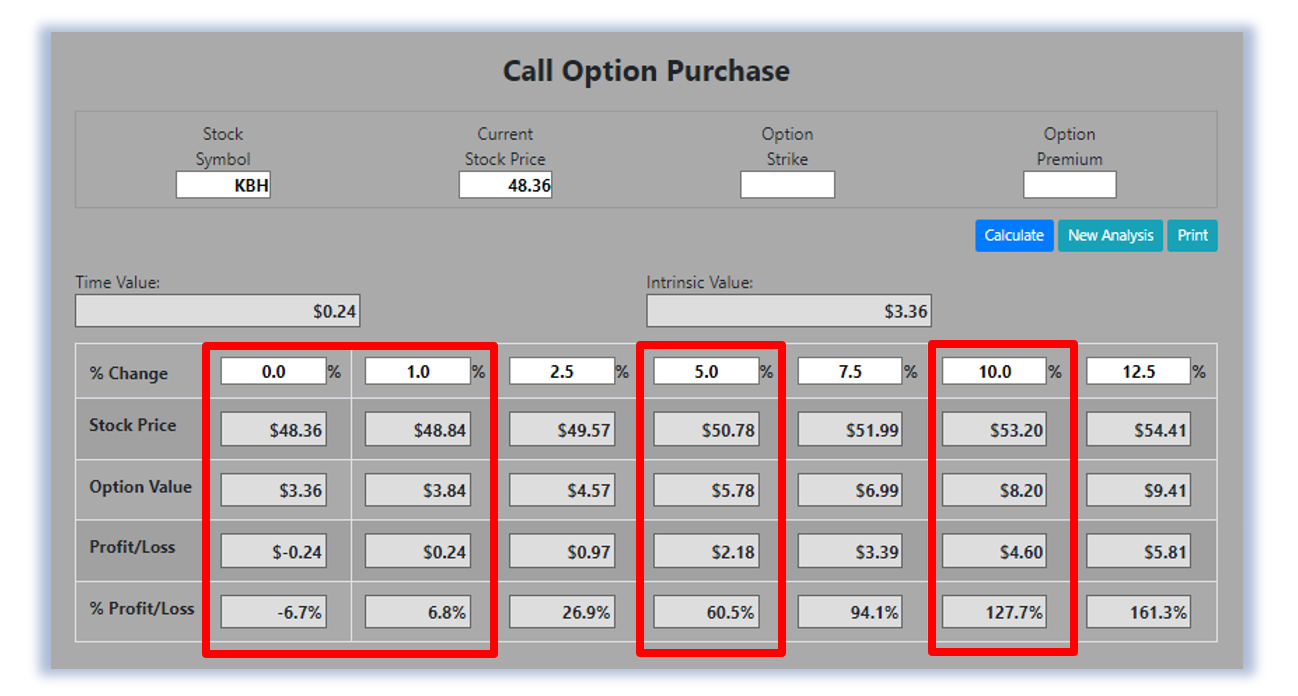
Now, since KBH’s 50-Day EMA is trading above the 100-Day EMA this means the stock’s bullish rally will likely continue. Let’s use the Hughes Optioneering calculator to look at the potential returns for a KBH call option purchase.
The Call Option Calculator will calculate the profit/loss potential for a call option trade based on the price change of the underlying stock/ETF at option expiration in this example from a flat KBH price to a 12.5% increase.
The Optioneering Team uses the 1% Rule to select an option strike price with a higher percentage of winning trades. In the following KBH option example, we used the 1% Rule to select the KBH option strike price but out of fairness to our paid option service subscribers we don’t list the strike price used in the profit/loss calculation.
Trade with Higher Accuracy
When you use the 1% Rule to select a KBH in-the-money option strike price, KBH stock only has to increase 1% for the option to breakeven and start profiting! Remember, if you purchase an at-the-money or out-of-the-money call option and the underlying stock closes flat at option expiration it will result in a 100% loss for your option trade! In this example, if KBH stock is flat at 48.36 at option expiration, it will only result in a 6.7% loss for the KBH option compared to a 100% loss for an at-the-money or out-of-the-money call option.
Using the 1% Rule to select an option strike price can result in a higher percentage of winning trades compared to at-the-money or out-of-the-money call options. This higher accuracy can give you the discipline needed to become a successful option trader and can help avoid 100% losses when trading options.
The goal of this example is to demonstrate the powerful profit potential available from trading options compared to stocks.
The prices and returns represented below were calculated based on the current stock and option pricing for KBH on 6/6/2023 before commissions.
When you purchase a call option, there is no limit on the profit potential of the call if the underlying stock continues to move up in price.
For this specific call option, the calculator analysis below reveals if KBH stock increases 5.0% at option expiration to 50.78 (circled), the call option would make 60.5% before commission.
If KBH stock increases 10.0% at option expiration to 53.20 (circled), the call option would make 127.7% before commission and outperform the stock return nearly 13 to 1*.
The leverage provided by call options allows you to maximize potential returns on bullish stocks.
The Hughes Optioneering Team is here to help you identify profit opportunities just like this one.
Interested in accessing the Optioneering Calculators? Join one of Chuck’s Trading Services for unlimited access! The Optioneering Team has option calculators for six different option strategies that allow you to calculate the profit potential for an option trade before you take the trade.
Average Portfolio Return of 213.8%
Below is a screenshot of the current open trade profit opportunities from Chuck’s Inner Circle Trading Service. There are currently $162,176.99 in open trade profit opportunities with an average portfolio return of 213.8% demonstrating the ability of the Optioneering Strategy to deliver substantial returns with no losing portfolios**.
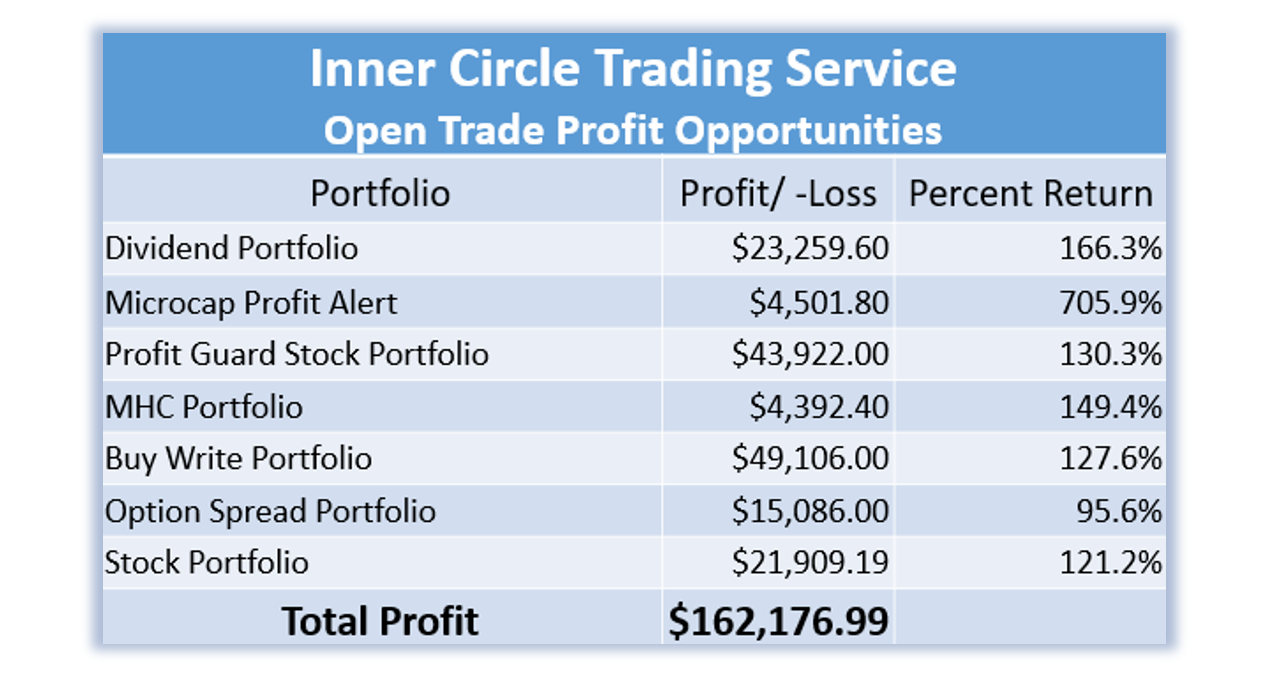
**Open trade profit results represent the open trade profit performance for the portfolio displayed on 6/6/23. Open trade profits may have increased or decreased when trades were closed out. Trading incurs risk and some people lose money trading. Past performance does not necessarily predict future results. Member profits and losses are not tracked. Profit potential is taken from results of signaled trades, not actual member results. Not all members make the trades.
Chuck’s $3,000 Trading Scholarship
I don’t want you to miss a single opportunity to potentially reach your goals. That’s why I’d like to offer you a scholarship of the full $3,000 Enrollment Fee of my exclusive Inner Circle Trading Service**.
I want you to follow in my footsteps for the opportunity to succeed beyond your wildest dreams, so please call Brad in my office at 1-866-661-5664 or 1-310-647-5664 and get started today!
You can also CLICK HERE to schedule a call now!
Wishing You the Best in Investing Success,

Chuck Hughes
Editor, Trade of the Day
Have any questions? Email us at dailytrade@chuckstod.com
*Trading incurs risk and some people lose money trading.
**Inner Circle Trading Service program provides training package and specific trade signals for one year. The first 10 people to sign up each day this offer is valid, will get a waiver of the standard fee, which is the price charged to anyone signing up after the first 10 people per day.


Recent Comments