
Wednesday, August 18th, 2021
Happy Wonderful Wednesday!
Last week, the market gave us four bullish days out of five. This week opened down. Weekly charts of the indices have gone flat and look as if they are tired and ready for a modest pullback. The three main indices moved sideways with quick daily swings.
To review past equity candidates, scroll down.
For today’s Trade of the Day, we will be looking at American Express Company, symbol (AXP). Before analyzing AXP’s chart, let’s take a closer look at the stock and its services.
American Express Company, together with its subsidiaries, provides charge and credit payment card products, and travel-related services worldwide. Its products and services include payment and financing products; network services; accounts payable expense management products and services; and travel and lifestyle services. The company’s products and services also comprise merchant acquisition and processing, servicing and settlement, point-of-sale marketing, and information products and services for merchants; and fraud prevention services, as well as the design and operation of customer loyalty programs. It sells its products and services to consumers, small businesses, mid-sized companies, and large corporations through mobile and online applications, third-party vendors and business partners, direct mail, telephone, in-house sales teams, and direct response advertising.
American Express Company was founded in 1850 and is headquartered in New York, New York. I looked through a lot of charts over the weekend. I zeroed in on AXP because it looks ready to pullback further. It is a widely traded stock with lots of volume.
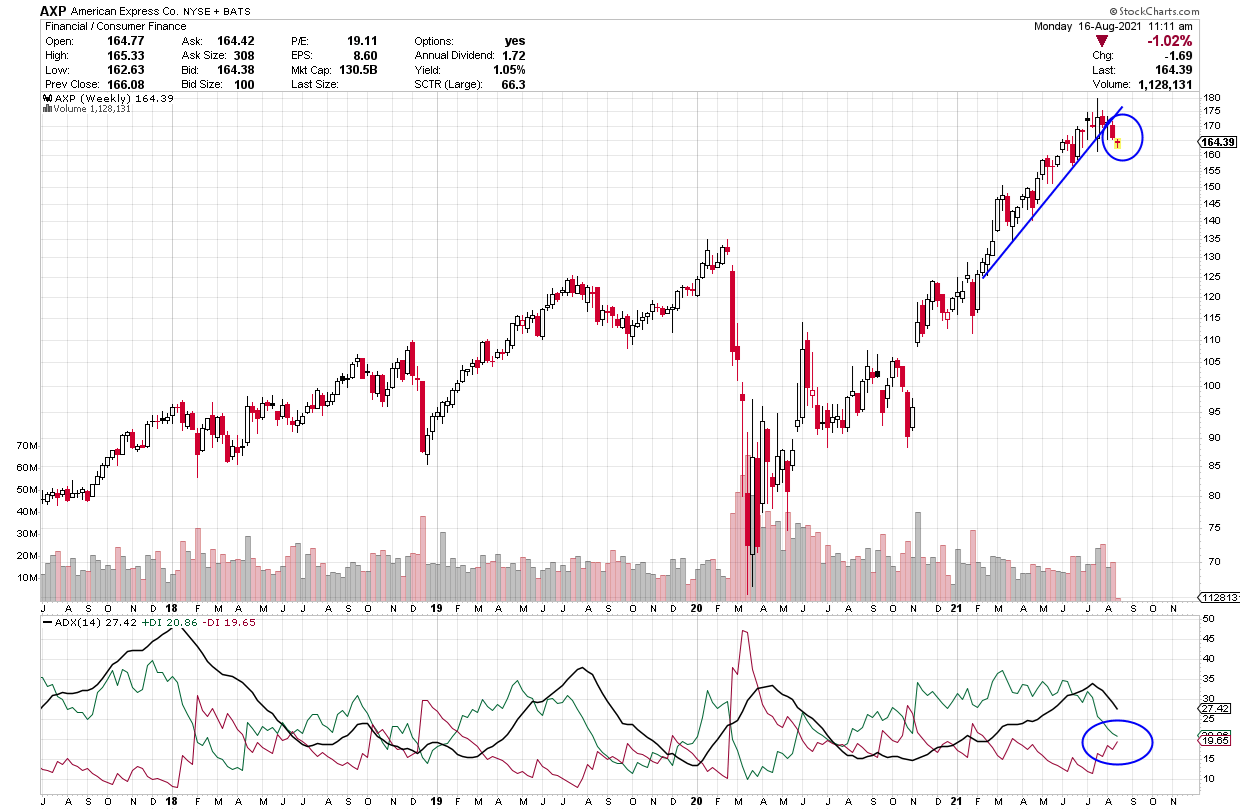

On the ADX indicator below the chart, notice how the green +DI line is on top but looks ready to cross down. The red -DI line is heading up and near a cross. These are all signals of bearish strength with the thought that price may continue to fall.
For those who want more info on ADX, I give more details in the section below, or scroll down to the trade info.
Average Directional Index (ADX) Points to Direction and Strength
ADX is an easy indicator to interpret. The +DI line (green) is bullish and when it is on top, it suggests price is going to head up. When the -DI line (red) is on top, it suggests price is going to drop.
The black line is the strength line and when it heads up, it is telling you strength is moving into the DI line that is on top and in control. When the ADX line has been heading down, the DI line on top has been weakening and is ready for a change.
When the DI lines swap places and cross up and the ADX heads up, it suggests strength is moving into the new DI direction.
ADX signal = Profit Payout
Each candle on the chart represents price movement of a week. As the + DI heads up and moves above the black line and both remain above the red line, it suggests there is bullish strength that could continue to grow, especially once the black line starts to turn up. If price continues to move up, the ADX line (black) will continue to turn to head up to imply that strength will continue to support the trade. As long as the ADX is heading up, it means it is supporting the bullish- up direction. The opposite is true if the -DI line heads up to cross the green +DI line – this suggests bearish strength and a drop in price. If the ADX line heads up while the red -DI is on top, is it saying strength is building into the downward direction.
I am looking at its chart and possible trade on Monday, but the pattern looks as if the DI lines are ready to cross. You don’t want to consider entry if the current candle doesn’t move below 162 or if the -DI line doesn’t cross up. If the lines cross, you can consider a Put trade.
If you are interested in learning more about the ADX strength line, I’d like to suggest you consider getting Inevitable Trend Moves. This book covers in detail how to trade the ADX to jump in during a confirmed strength stage that is as clear as looking at a picture with arrows pointing out direction.
AXP Potential Trade
Please note and remember that I am typing this on Monday, two days before you receive it and the information, I am sharing could change over those two days and is intended to share the opportunities that options offer us.
American Express (AXP) last week turned down pulling back and this week it continued that downward move. It appears to be ready to head lower and have a DI line cross pattern, if this happens, the pattern should remain intact as price keeps dropping. Notice the + DI is heading down and is still above the -DI line on the chart above. We want the – DI to cross below the -DI (green below the below red) to consider a trade. Red line on top is bearish.
Price is likely to drop further and move below 162 entry. Its first target is 150 as the -DI (red line) moves up and the ADX (black line) turns up. Its current downtrend should remain intact, and price should continue to drop, perhaps even lower to 145. We will keep an eye on AXP over the next couple weeks.
I am looking at charts on Monday, so prices are apt to change a little by Wednesday. Be sure the red -DI has crossed above the green +DI line before entry.
The short-term price target for AXP is $150, then, perhaps, $145, and lower.
To buy shares of AXP today, price would be approximately 164. If it drops to $150 that would be a loss of $14 or 9% loss in a short period of time. If you bought 4 shares the total cost would be $656, and you would lose $56 total on the four shares. Of course, if you thought price is going to drop, you would wait to buy the shares until you thought price was done dropping and going to rise.
This said, option trading offers the potential of a smaller initial investment and higher percentage gain even when price is expected to rise. Let’s take a look.
If you bought one Put option contract covering 100 shares of AXP’s stock with an Sept 10th expiration date (Sept wk 2) for the $150 strike and premium would be approximately $.80 today or a total of $80 per contract. If price decreased the expected $14 to $150 target over the next few weeks, the premium might increase approximately $5 to $5.80 per share or $580 on your 100-share contract. This is a gain of $500 on your $80 investment or a 625% gain over a few weeks.
Remember you can close an option trade anywhere along the line before expiration to take gains or stop a loss.
The example above is a comparison of an investment of $656 and a $56 loss versus an $80 investment and $500 profit. Big difference.
Options can offer a win, win, win trade opportunity. They often offer a smaller overall investment, covering more shares of stock and potentially offer greater profits.
If you are having any kind of trouble taking advantage of these trades, I don’t want you to miss out. I have put together programs that help traders just like you access the potential profits that options provide. I write like we are having a conversation, so the information is easy to understand and apply. Be sure to check out the programs shared in this email and we will make it easy for you to get your share.
I love to trade, and I love to teach. It is my thing.
Yours for a prosperous future,
Wendy Kirkland
PS-I have created this daily letter to help you see the great potential you can realize by trading options. Being able to recognize these set ups are a key first step in generating wealth with options. Once you are in a trade, there is a huge range of tools that can be used to manage the many possibilities that can present themselves. If you are interested in learning how to apply these tools and increase the potential of each trade, click here to learn more.

Review of Past Candidates:
Three weeks ago, we looked at ConocoPhillips (COP) with an Aug 20 expiration for the 62 strike and a premium of .60. Last week and this week are down. Actually, now its chart looks quite like AXP. (click here for the article)
Two weeks ago, we studied Applied Materials (AMAT) August 27th expiration 150 strike for 3.60 Monday. On Weds the 4th, it was probably more like 2.90. Price is up 1% this week, but it dropped hard last week so it is at $131 as I type and it will be a hard fight to reach its target. (click here for the article)
Last week, we discussed WMT and a Sept 3rd expiration (Sept Wk 1) and a 150 strike with a premium of 1.72. This week despite the market drop, WMT rose and premium went as high as 4.00 and is now 3.30. Nice profit of more than double. (click here for the article)


Recent Comments