
Dear Reader,
Yesterday, we looked at a Monthly Price Chart for Kinsale Capital Group, Inc. noting that the stock’s 1-Month Price is trading above the 10-Month SMA signaling a ‘Buy’.
For today’s Trade of the Day e-letter we will be looking at a daily price chart for Comcast Corp. stock symbol: CMCSA.
Before breaking down CMCSA’s daily chart let’s first review what products and services the company offers.
Comcast Corporation operates as a media and technology company worldwide. It operates through Cable Communications, Media, Studios, Theme Parks, and Sky segments. The Cable Communications segment offers broadband, video, voice, wireless, and other services to residential and business customers under the Xfinity brand; and advertising services.
Now, let’s begin to break down the Daily Price chart for CMCSA stock.
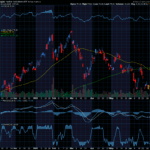
Below is a Daily Price chart with the 50-Day EMA and 100-Day EMA for CMCSA.

50-Day EMA and 100-Day EMA ‘Sell’ Signal
The 50-Day Exponential Moving Average (EMA) and 100-Day EMA are moving average indicator lines that can provide buy and sell signals when used together. When the shorter-term 50-Day EMA crosses above or below the longer-term 100-Day EMA, this provides either a buy or sell signal depending on which direction the stock price is moving.
- 50-Day EMA line Above 100-Day EMA = Price Uptrend = Buy signal
- 50 Day EMA line Below 100-Day EMA = Price Downtrend = Sell signal
When the 50-Day EMA (blue line) crosses above the 100-Day EMA (red line) this indicates that the stock’s buying pressure has begun to outweigh the selling pressure signaling a ‘buy’ signal. When the 50-Day EMA crosses below the 100-Day EMA this indicates that the selling pressure has begun to outweigh the buying pressure signaling a ‘sell’ signal.
Sell CMCSA Stock
As the chart shows, on October 15th, 2021, the CMCSA 50-Day EMA, crossed below the 100-Day EMA.
This crossover indicated the selling pressure for CMCSA stock exceeded the buying pressure. For this kind of crossover to occur, a stock has to be in a strong bearish trend.
Now, as you can see, the 50-Day EMA is still below the 100-Day EMA meaning the ‘sell’ signal is still in play.
As long as the 50-Day EMA remains below the 100-Day EMA, the stock is more likely to keep trading at new lows and bearish positions should be initiated.
Our initial price target for CMCSA stock is 28.25 per share.

84.2% Profit Potential for CMCSA Option
Now, since CMCSA’s 50-Day EMA is trading below the 100-Day EMA this means the stock’s bearish decline will likely continue. Let’s use the Hughes Optioneering calculator to look at the potential returns for a CMCSA put option purchase.
The Put Option Calculator will calculate the profit/loss potential for a put option trade based on the price change of the underlying stock/ETF at option expiration in this example from a flat CMCSA price to a 12.5% decrease.
The Optioneering Team uses the 1% Rule to select an option strike price with a higher percentage of winning trades. In the following CMCSA option example, we used the 1% Rule to select the CMCSA option strike price but out of fairness to our paid option service subscribers we don’t list the strike price used in the profit/loss calculation.
Trade with Higher Accuracy
When you use the 1% Rule to select a CMCSA in-the-money option strike price, stock only has to decrease 1% for the option to breakeven and start profiting! Remember, if you purchase an at-the-money or out-of-the-money put option and the underlying stock closes flat at option expiration it will result in a 100% loss for your option trade! In this example, if CMCSA stock is flat at 30.47 at option expiration, it will only result in an 8.2% loss for the CMCSA option compared to a 100% loss for an at-the-money or out-of-the-money put option.
Using the 1% Rule to select an option strike price can result in a higher percentage of winning trades compared to at-the-money or out-of-the-money put options. This higher accuracy can give you the discipline needed to become a successful option trader and can help avoid 100% losses when trading options.
The goal of this example is to demonstrate the powerful profit potential available from trading options compared to stocks.
The prices and returns represented below were calculated based on the current stock and option pricing for CMCSA on 10/14/2022 before commissions.
When you purchase a put option, there is virtually no limit on the profit potential of the put if the underlying stock continues to decline in price.
For this specific put option, the calculator analysis below reveals if CMCSA stock decreases 5.0% at option expiration to 28.95 (circled), the put option would make 38.0% before commission.
If CMCSA stock decreases 10.0% at option expiration to 27.42 (circled), the put option would make 84.2% before commission and greatly outperform the stock*.
The leverage provided by put options allows you to maximize potential returns on bearish stocks.
The Hughes Optioneering Team is here to help you identify profit opportunities just like this one.

Interested in accessing the Optioneering Calculators? Join one of Chuck‘s Trading Services for unlimited access! The Optioneering Team has option calculators for six different option strategies that allow you to calculate the profit potential for an option trade before you take the trade.
Average Portfolio Return of 128.7%
Below is a screenshot of the current open trade profit opportunities from Chuck’s Weekly Option Alert Trading Service. There are currently $170,647.40 in open trade profit opportunities with an average portfolio return of 128.7% demonstrating the ability of the Optioneering Strategy to deliver substantial returns with no losing portfolios**.

**Open trade profit results represent the open trade profit performance for the portfolio displayed on 10/14/22. Open trade profits may have increased or decreased when trades were closed out. Trading incurs risk and some people lose money trading. Past performance does not necessarily predict future results. Member profits and losses are not tracked. Profit potential is taken from results of signaled trades, not actual member results. Not all members make the trades.
Get Trade Insights Directly From Chuck
You can start getting market insights directly from 10-Time Trading Champion Chuck Hughes.
See what he’s trading and when with his exclusive Inner Circle Trading Service where he will send you his hand-picked stock and option trades.
Just call Brad at 1-866-661-5664 or 1-310-647-5664 to join or CLICK HERE to schedule a call!
Wishing You the Best in Investing Success,

Chuck Hughes
Editor, Trade of the Day
Have any questions? Email us at dailytrade@chuckstod.com
*Trading incurs risk and some people lose money trading.


Recent Comments