
by Rob Roy
The delta and gamma numbers can be expressed into a graph for greater clarity. The delta graph is a result of a gamma graph, however being that these two option Greeks are so interrelated, the focus will be on the delta graph.
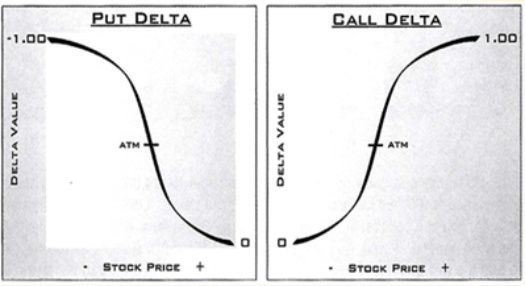
The image below shows the delta curve for the put on the left and the call on the right. The X-axis is the stock price raising price to the right, and lowering price to the left. The Y-axis is the delta value. Again, the delta is unable to go above 1.00 (negative for puts) or below .00. The ATM (at-the-money) location is marked, and always has a delta of about .50 (negative for puts).
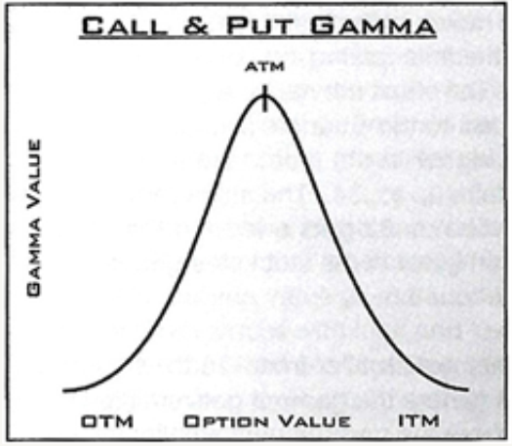
The following image shows the gamma curve for both the calls and pus. The gamma curve is a normal distribution curve. The X-axis is the stock price raising to the right and lowering to the left. The Y-axis is the gamma value. There are not values for this gamma curve, as each stock’s gamma will have different numerical values to their gamma. The ATM location is marked and showing that there is the most gamma ATM, and the gamma gets smaller as you look further ITM (in-the-money) or OTM (out-of-the-money).
An analogy for this would be a car, where the delta is the speed and the gamma is the horsepower. Some cars can get from 0-60 mph very fast, where some cars can get from 60-100 mph very fast. In a Straddle or Strangle, the delta (or speed) is at .00. The trade makes money (gets up to speed) from the gamma (or horsepower). The more gamma, the faster the profits.
This is where most traders are taught to use Straddles rather than Strangles. The Straddles are created ATM where the gamma is the highest. However, if you look at the delta and gamma curves the speed at which the Straddle makes money slows down quickly. That is because even though the trader started the trade at the highest value gamma, as the stock moves one way or the other, the speed at which the delta grows slows down from the down slope in the gamma curve.

When a trader creates a Strangle trade, OTM options are used. The OTM options have several advantages. The first is that while the trader is buying loser deltas and therefore smaller gammas, the OTM options will run up the gamma curve increasing the speed at which the delta grows faster than the Straddle. The horsepower of the Strangle is gaining at the start of the trade, while the horsepower of the Straddle is dwindling.
Selecting Strikes via Delta
This is key to Straddles and Strangles. The best combination of speed and horsepower come from a trade that is created using a call delta in the range of 25 to 35 and a put delta in the range of -25 to -35. What this gives the trader is a starting delta that, if the stock should move in their favor, they make money the fastest. This is due to the location of the selected deltas on the delta curve. It yields the trader the quickest increase in delta when they are in the right direction, yet they tend to lose at a slower pace. Owning both a call and a put means that when the stock trends in a direction they get the quickest gain from one option, while losing slower on the other.
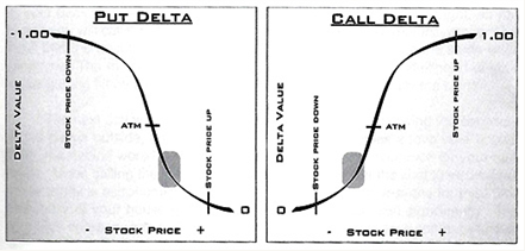
In the image below the Put deltas are on the left and the Call deltas are on the right. The highlight represents the 25 to 35 (negative for puts) delta range. The text notating “stock price up” shows the call side delta with more room to move up the delta curve – profiting – while the put delta has a smaller and slower amount of room to move down the delta curve – losing value. The text “stock price down” shows the same if the stock was to break to the downside. The put side delta has more room to move up and profit on the delta curve while the call delta has less room to move down the delta curve, losing money slower.
This relationship of call and put delta is the main way that Straddles and Strangles profit during a trade. Keep in mind, however, that this is not the only way in which they can make or lose money.


Recent Comments