
by Dale Brethauer
All the focus in the stock market literature is on making a good trade entry. Yes, that is important, but the exit is where a lot of money can be gained or lost. You also want to know when you will exit before putting on the trade. This allows you to calculate your risk/reward.
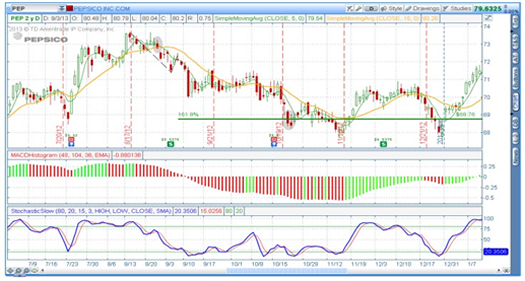
The chart below shows the difference between getting out of a trade while it is still moving in the trend versus waiting for a sell signal on a reversal. We had an option contract (Jan 80 put) on PepsiCo (PEP) which we purchased 8/29/2012. We exited 10/19/2012 when it hit a Fibonacci extension of 161.8% indicating an extreme oversold condition. This resulted in a 45% profit. If we would have waited to exit after it made its low and started back up we would only have profited by 32% or less. This difference of 15% on a trade can make the difference between your overall success or failure.
My exit strategy relies solely on the Fibonacci extension. Fibonacci ratios may be seen throughout nature. As you go up the stem of a flower the leaves grow at a proportional distance of the ratio. The spirals of a conch shell are proportional to the ratio. The distance of the human forearm to the hand is proportional to the ratio, etc. Therefore, doesn’t it make perfect sense that the stock market, which is fueled by human fear and greed, would move in perfect harmony with nature?
The Fibonacci ratio comes from a number sequence that is derived by adding the current number to the previous number to get the next number in the sequence. It is: 0,1,1,2,3,5,8,21,34.
The Root Fibonacci ratio is calculated by taking any number in the sequence and dividing it into the previous number. In other words 18/34 =.618 or the Root Fibonacci ratio. If you take the square root of the Root it is .786 and the Root squared is .382. By taking the reciprocal of these numbers you get 1.272, 1,618 and 2.618.
These are the numbers which I use to determine the extent of the stock move after a measured move occurs. A measured move is when a new high happens after a previous high and a pullback to a higher low, or a new low after a previous low and a pullback to a lower high.
Usually at 127%, 161% and 261% a stock price advance will stop, consolidate, retrace or completely turn around. The more you use Fibonacci extensions to time your exits the better your trading will become.


Recent Comments