
Learning new ways to find trades never gets old.
I remind myself that my life is rich with opportunities. Every day is a new start. I decide what I want to play out and I move in that direction. Take a step and then another… I will succeed! Try this belief or knowing and see what you can create. It is pretty amazing.
Here’s What Is Covered Below:
Exponential Moving Averages (EMA)
- Decide on the time frame chart that is tight for you?
- How much time do you want to spend trading?
- Flexibility is possible!
Today, we are going to discuss two subjects. Exponential Moving Averages (EMAs) can help you decide what time frame chart is right for you to trade. How much time do you want to spend trading each day? Each week?
In general terms, chart indicators paint a picture of what is happening with price. They tell you where price has been and where it will likely go next. Some indicators like EMAs give a clue about the strength of the move.
On past Fridays, we have discussed different time frame charts and other indicators. We are going to relook at this topic to help you determine what is a good time frame for you to focus on as you devote time to trading. How much time do you want to spend trading?
I am going to post a chart with just two Exponential Moving Averages (EMAs) on it. EMAs show you price movement over a given period of time. The first chart is a daily chart. When the EMAs cross up or down, it is showing that the direction of price has changed on that time frame chart.
I want to draw your attention to the fact that the lines do not cross too often on a daily chart.
The chart below is for Peleton (PTON):

Stockcharts.com

I selected PTON because it is just now having a cross down of the 8 EMA over the 13 EMA. If you scroll back over the chart, you will note there are about 8 actual crosses. A couple just lasted a day or two and others lasted for months.
The short-term crosses and or trades would have been small losses or about even, but the main crosses certainly would have made up for the small losses.
Now let’s look at a 60-minute chart and see how much more often the crosses took place. It will require more time-attention.
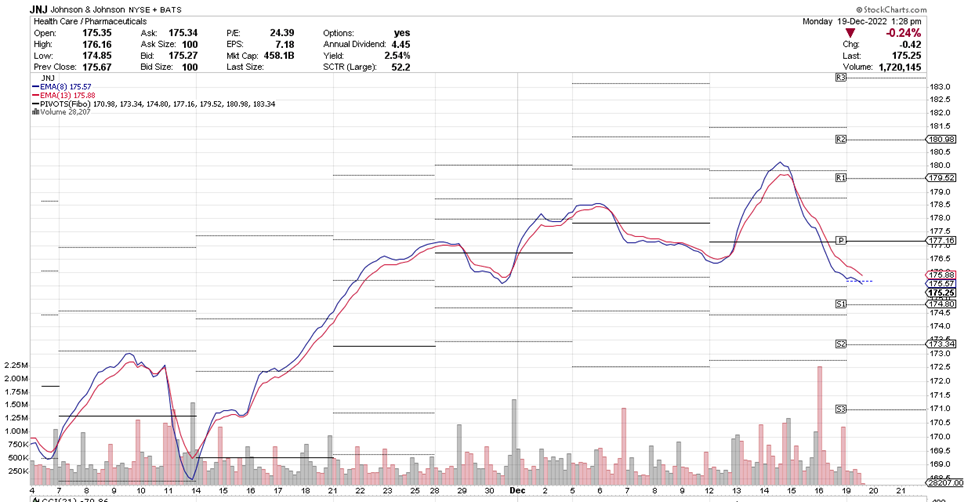
Stockcharts.com
On JNJ, you can see the crosses lasted for a few days up to a week+ and would require more attention than the daily chart. You likely could spend a few minutes a day checking direction and crosses.
I will also post a 30-minute chart, and you will see that it will require even more time to navigate crosses.
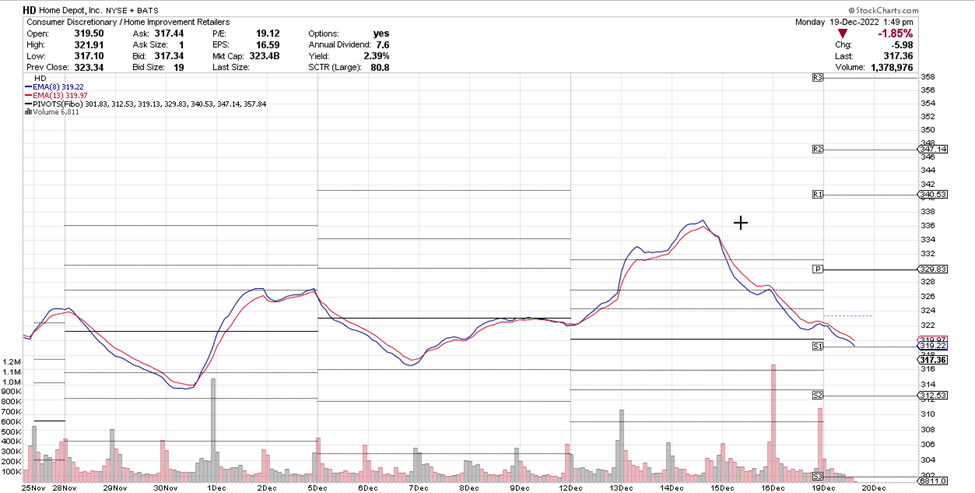
Stockcharts.com
This chart for Home Depot (HD) would again require even more attention. Perhaps, you would check it a couple times a day, to make sure it was maintaining its direction with no crosses and as the lines flattened out you would watch even closer. Now remember, we are talking about actual crosses, not just EMA touches.
This EMA check is a great way to zero in on deciding on a time frame to trade and of course, as the amount of time you have to trade changes, you can certainly make a change and adjust as needed.
These lines are sharing information with you.
I hope you find this information useful.
Friday is education day. My goal is to teach everyday people (like me) to successfully trade options. I do my best to write in an understandable way as if we are talking while sitting on the deck of my house in a relaxed atmosphere.
The trading tools you select, and use are important, and can make your trading easier and more effective.
Being thankful is one of the strongest and most transforming mindsets. It shifts your perspective from lack to abundance and allows you to focus on the good in your life, which in turn pulls more joy and goodness into your reality. Look at you, you are doing great!
Have a great trading day.
And I wish you the very best,
Wendy


Recent Comments