
by Oliver Velez
I am not a big believer in the use, or overuse, of technical indicators. There are charting packages available today that literally contain hundreds of technical indicators. Just the single fact that there are hundreds available should tell you the value of any one of them. They are often very popular with novice traders because they tend to represent something newcomers to the market like to see. Many new traders are often searching for the Holy Grail of trading. They’re looking for that one market guru or that one indicator that will deliver consistent profits time and time again.
Something you need to understand about technical indicators is that they all have one thing in common. They are all taking the past price and volume data on your charts and creating a new line from old data. They have a value in many instances but should never be used make buy and sell decisions. Traders often find one particular indicator that works on a certain stock for a certain period of time and feel they have found the Holy Grail to trading. However, they soon discover that the indicator needs to be tweaked and adjusted and eventually discarded. For making buy and sell decisions, there is nothing superior to the price pattern itself.
The danger is in feeling that any single indicator will give you consistent profits. I have seen traders use so many indicators on their charts that it is difficult to even see the price bars through the mess of spaghetti on their chart. Some traders find that one or two particular indicators help them in the process of making a decision and that is perfectly find. Moving averages are actually technical indicators. While they are the simplest of the indicators, they do present us with valuable information. But I do not use moving averages to determine my entry. I use them as a guide to help determine the quality of the trend. The proper use of technical indicators is to use them as a filter. By that I mean once your decision is made to enter a position, you may choose not to because the indicator has not “approved” the trade.
These tools are all that I have on my charts: Japanese candlesticks, color-coded volume, the 20- and 40- period moving averages, and the Commodity Channel Index (CCI). These are all the tools that are needed to swing trade affectively.
The Japanese Candlestick
A price chart is not a price chart to me unless it is displayed in Japanese candlestick form. Technically, a Japanese candlestick does not display any more information than a regular bar chart. They both display the opening, closing, high, and low of that particular period. The difference is that the Japanese candlesticks display the information in a way that is much easier to see visually. The area between the high low is colored either red (black or closed) or green (white or open) depending upon whether the stock closed above or below the opening price. This places the emphasis on who won the battle each and every time period.
The Critical Nature of Volume and Price
The next tool that should be on all of your charts is color-coded volume bars. The understanding of volume in conjunction with price is critical to your success as a trader. Traders who understand these can make a living in the markets without the need of anything else. Now despite what I just said, the concept of volume is often misunderstood and overused. There are literally entire books written on volume, but when it comes down to it, volume really serves two main purposes. Increases in volume can help identify the beginning of new moves, and they can help identify the ending of old moves.
The CCI Technical Indicator
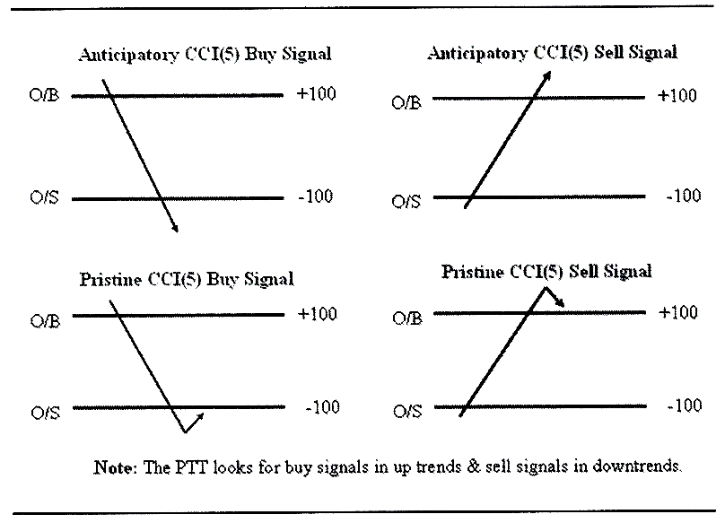
Let’s take a look at another tool of the swing trader. It is a technical indicator known as the CCI, which is an abbreviation for the Commodity Channel Index. The indicator I liked to use on daily charts is the 5-period CCI. In practice, I typically overlay the CCI over my volume on the bottom panel of the chart. The image below shows what the CCI looks like all by itself, and how we use it.
The Importance of the Buy Setup
I want to introduce you to this tool. If we are waiting to buy a stock, we want the CCI to drop below -100. Once it does that, its job is done as it has now “approved” the trade. It does not need to be below -300 to enter the trade. Notice that while we call this an anticipatory buy setup, it should never be considered a buy on its own. It is only a filter to discard the trade if the CCI does not do what you need it to do.
The 20- and 40-Period Moving Averages
The other toos we will need are the 20- and 40-period moving averages. These are used to help determine the quality of the trend that the stock is in.


Recent Comments