
I’m not sure if you missed this but take a look at an example of a great potential trade I spotted.
Shopify, Inc. (SHOP) just moved above 0 on the TSI Indicator. Don’t worry, I’ll walk you through what that means.
Each candle on the weekly chart represents price movement over a 5-day (week) period. The indicator at the bottom of the chart is a True Strength Indicator (TSI). To learn more about TSI, click here.
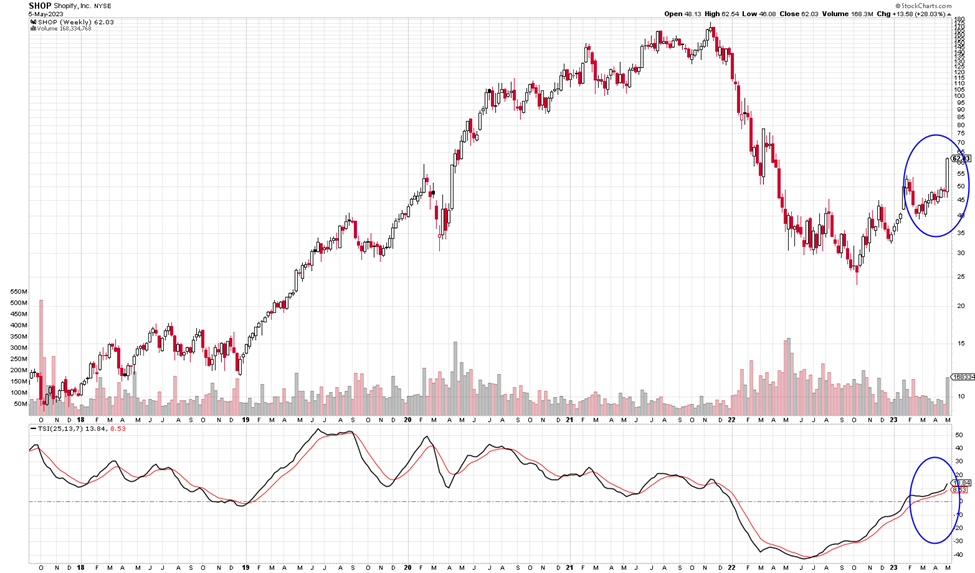

If SHOP’s price continues to move up in this example, you could consider a Call trade. If the price continues to move to $63, you could consider a call option trade. We are expecting the TSI indicator to continue to head up.
SHOP’s is bullish as the signal line moves above the 0. The short-term target is $70 and then higher.
You could use a Call option to increase the potential of this trade. Option trading offers the potential of a lower initial investment and higher percentage gain. It is like renting stock versus buying out right.
If you bought one Call option contract covering 100 shares of SHOP’s stock with a June 16th expiration date for the 70 strike, the premium would be approximately $1.75 per share, or a total of $175 for the contract of 100 shares. If price rose the expected $7 over the next few weeks, the premium would likely increase approximately $3.50 to $525. This is a gain of 200% profit. That would be a nice trade over a short period of time!
Learning more about trading and how to use options is one of the best investments you can make. For more examples like this one and to learn about various indicators that help increase your wins, be sure to visit our site here.
I send you wishes for the very best,
Wendy

Previous Trade:
Last week we discussed buying LULU 390 calls. On 5-2 the premium for the May 18th 390 call was $4.45. On 5-5 you could have sold for $6.00, a 35% profit.


Looks like SHOP has already broken below resistance point to the low side . It had traded for 65.50 to the up side , I think it might have to break above 65 to get in . What do you think ?