
Dear Reader,
While I was watching the markets and today’s trading action, when I came across this one ETF in particular, what I saw piqued my interest.
The trade that came over the wire just a few hours ago was for the SPDR Gold Shares symbol: (GLD).
It’s what I saw in GLD’s stock chart that made this potential trade stand above the rest when I saw it today.
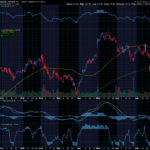
Take a look below at a current snapshot of GLD’s stock chart and I’ll break down for you what I see when I see this chart.

When looking at this stock chart for the SPDR Gold Shares ETF, the first thing that stands out to me is the powerful technical ‘Buy’ signal that is currently flashing!
In this daily price chart, you can see there are also two Exponential Moving Averages (EMA) overlaid. The shorter term line is the 50-Day EMA and the longer term line is the 100-Day EMA.
The chart shows that in late November ‘23, as GLD was beginning to gain steam and trade higher, the ETF’s 50-Day EMA crossed above the 100-Day EMA. This created a brand new technical ‘Buy’ signal for GLD shares.
When I come across a technical signal like this, I consider it a ‘Buy’ because the shorter term EMA is beginning to outpace the longer term EMA which is indicative of a sustained move higher.
In order for an EMA crossover like this to occur, strong buying pressure has to be generated for an ETF, driving the shares higher. An EMA trading system like the 50/100-Day EMA system, is able to identify these sustained momentum thrusts when the crossover occurs offering traders an opportunity to jump in and participate in the move.
Now, even though the original crossover occurred a few months back, this does not mean it is too late to capitalize on the ETF’s bullish trend. When ETF’s break out to the upside like this, the bullish trend can often last longer than one might think.
Since the 50-Day EMA is still trading above the 100-Day EMA, this means the ‘Buy’ signal is still intact and this trend is still tradable. Since this bullish trend is still in play, let’s discuss how I would look to place a trade on GLD.
 Limited Time Offer: Join Now for Just $1!
For a limited time, you can join Optioneering Newsletter for just $1 for your first month – that’s a massive 97% discount off the regular monthly subscription fee of $39! Don’t miss out on this incredible opportunity to elevate your trading game.
How I Would Look to Trade It
Since GLD’s 50-Day EMA is still trading above the 100-Day EMA signaling the ‘Buy’, this is offering an attractive trading setup. The next question is how do we actually want to gain exposure to this trade?
Of course you could simply buy the ETF shares, which we sometimes do, but, many times when we spot a setup like this we want to add a bit more leverage to our position to unlock more explosive profit potentials.
With a setup like this, we like to find a call option to purchase which would provide us with a little more leverage on our trade. By doing this, should the bullish trend continue, our trade is positioned to produce higher profits when compared to just owning the underlying ETF shares.
When selecting which call option to purchase, I often rely on my 1% Rule to help narrow down my choice of option strikes. The 1% Rule helps me select an in-the-money option that has a higher probability of producing a profit when compared to an at-the-money or out-of-the money option. Once I have one selected I will vet the trade using my Call Option Purchase calculator to determine the trade’s profit potential.
Below is a snapshot of my Call Option Purchase Calculator that shows the profit potential analysis for my trade. This example examines a range of GLD shares remaining flat up to a 12.5% increase at option expiration.

141.1% Profit Potential for GLD Option
The trade analysis shows that if GLD shares were to increase by just 1% at option expiration, this trade would make 10.4%.
Then looking at a few of the bigger potential moves, if GLD shares were up 5.0% at option expiration, our option would be set to profit 68.5%!
If that doesn’t sound good enough, get this, if GLD shares were up 10.0% at option expiration, this call option would be set to produce a 141.1% profit! That means the call option would outperform the ETF more than 14 to 1!
By following my 1% Rule to select which call options to purchase, this has helped me in the past to juice my trade’s profit potential, just like in the example shown above. Additionally, the 1% Rule helps to increase the odds that the option will profit as the underlying ETF only has to increase by 1% for the option to begin profiting.
The Hughes Optioneering Team is here to help you identify high-probability trades just like this one.
Interested in accessing the Optioneering Calculators? Join one of Chuck’s Trading Services for unlimited access! The Optioneering Team has option calculators for six different option strategies that allow you to calculate the profit potential for an option trade before you take the trade.
Chuck’s Lightning Trade Alerts!
Chuck Hughes is offering YOU an opportunity to join his exciting trading service program, Lightning Trade Alerts. This service focuses on low-cost & short-term options trades.
Members will receive hand-picked trades from the 10-Time Trading Champion, Chuck Hughes.
Please give my team a call at 1-866-661-5664 OR ‘Click the button’ below to schedule a call and get started today!

Wishing You the Best in Investing Success,

Chuck Hughes
Editor, Trade of the Day
Have any questions? Email us at dailytrade@chuckstod.com
*Trading incurs risk and some people lose money trading.


Recent Comments