
There is something very interesting about option trading. If everyone wanted to do it; if they all wanted the same thing, it wouldn’t change a thing. There is enough for all. And you in the right place. I am going to help you learn!
Here’s What Is Covered Below:
- Average Directional Index (ADX)
- Red and Green Lines- what do they mean?
- Which is best?
- Apply them to a chart strategy.
Today, we are going to discuss the Average Directional Index (ADX) and how to apply the information it shares.
In general terms, chart indicators paint a picture of what is happening with price. They tell you where price has been and where it will likely go next. Some indicators like ADX give a clue about the strength of the move.
On past Fridays, we have discussed different time frame charts and other indicators. I feel like ADX is an important indicator and it takes information to know how to read the chart indicator. It isn’t hard, it just takes an understanding of the lines incorporated within the indicator.
The ADX indictor includes or is made up of 3 lines: red, green and black.
Red line= Bear movement- drop in price- -DI
Green= Bullish movement- rise in price- +DI
Black= Strength
The chart below is for Amazon (AMZN):
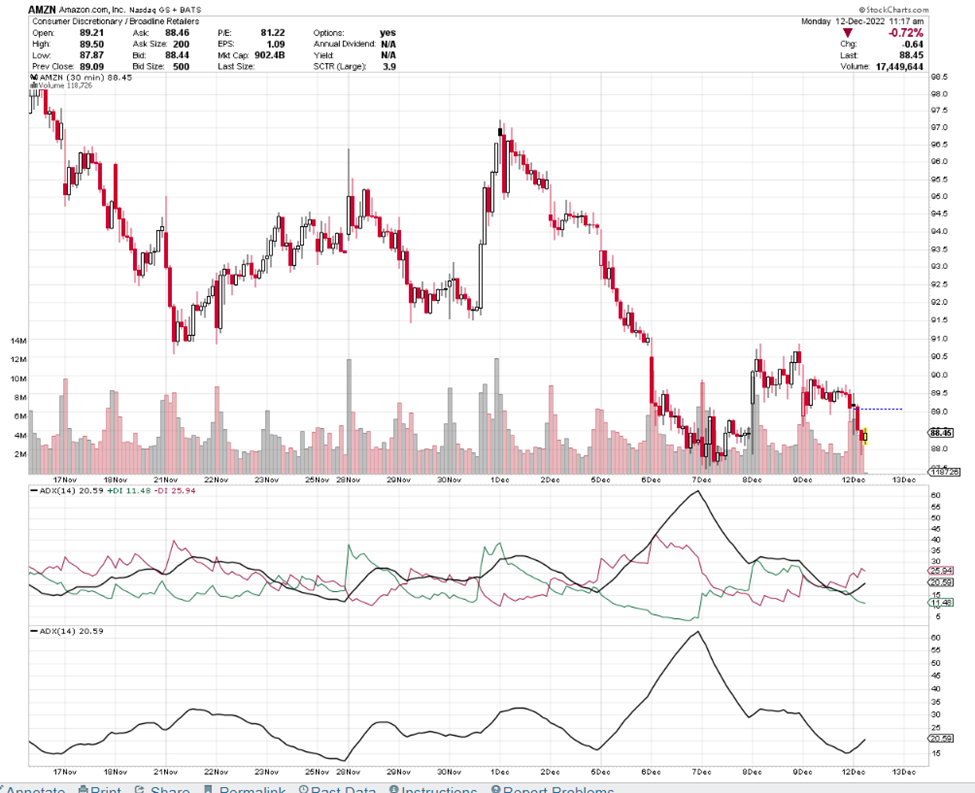
Stockcharts.com

The chart above has two ADX indicators. The bottom one is just the ADX strength line and the one above had the Directional Index lines (+DI and -DI).
Let’s start with the ADX indicator (just the black line). It is a strength line. When it is rising, it means that there is lots of strength in the move. Notice the rise on December 5th. That is a strong move based on the ADX line and another strong move appears to be starting today as I type on the 12th.
The rising line shares information about strength, but it doesn’t tell us if the move is a strong drop in price or a rise and this is where the indicator with the DI lines comes in handy.
Look at the upper ADX indicator with the red/green lines. On December 5th, the line on top was red, which means price was having a strong drop. It is the same today on the 12th, the red line is on top.
If you look at December 9th, the ADX line rose for a short period while the green line was on top and then it flattened out. A flat is likely just exactly what you imagine. Flat price, no strength in either direction.
When the black line drops, it is showing that previous strength is fading which often gives the opposite DI line the opportunity to flex its muscles and move to the top.
If you are trading Put options, the strength behind the red line will be important to you. If you are trading Call options, the green line on top will show it is in control.
I will post another time frame chart for General Electric (GE), so you can start interpreting this information.

Stockcharts.com
This chart for GE is a daily chart, where each candle represents price movement for one day, where AMZN was a 30-minute chart and each candle showed 30-minute price moves.
You will notice on the chart above that price rose through the month of October and into November. The strength line (black) rose, and the green (+DI) line was on top.
As you study the charts, start to notice the DI line cross overs and when the ADX line starts to head up. These lines are sharing information with you.
I hope you find this information useful.
Friday is education day. My goal is to teach everyday people (like me) to successfully trade options. I do my best to write in an understandable way as if we are talking while sitting on the deck of my house in a relaxed atmosphere.
The trading tools you select, and use are important, and can make your trading easier and more effective.
You may be mesmerized by professional traders, their trophies, and daunting achievements that you aspire to achieve, and it is easy to forget that those achievers, more often than not, started with far less than they have now. Perhaps, less than you have. You are poised to achieve all that you desire!
Have a great weekend.
And I wish you the very best,
Wendy


Recent Comments