
The latest move in the S&P is setting off all kinds of signals. This one in particular caught my attention.
The S&P was up 4 out of 4 days last week. It’s been mostly down for the past several weeks.
I am going to focus on the S&P on Mondays and call it “Momentum Monday”. I will focus on SPY, which is the ETF covering companies traded within the SPX Exchange Traded Fund.
Before analyzing SPY’s charts, let’s take a closer look at the ETF and its services.
SPY, or the SPDR S&P 500 trust, is an exchange-traded fund that trades on the NYSE Arca under the symbol SPY. SPDR is an acronym for the Standard & Poor’s Depositary Receipts, the former name of the ETF. It is designed to track the S&P 500 stock market index. This fund is the largest ETF in the world and gives a good overall picture of the market. SPY includes shares from the top 500 companies.
The image below is Friday’s price activity.

This chart image is courtesy of FINVIZ.com a free website and gives a quick view of each day’s movement.
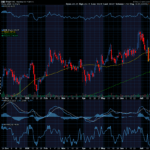
The chart of the S&P below is a weekly chart with a PPO indicator at the bottom. The description coming up next explains how to use the PPO.
Percentage Price Oscillator or PPO
Stockcharts.com provides a great definition of the Percentage Price Oscillator (PPO), which “is a momentum oscillator that measures the difference between two moving averages as a percentage of the larger moving average”. The Percentage Price Oscillator is shown with a signal line, a histogram, and a centerline. Signals are generated with signal line crossovers, center line crossovers, and divergences, or surprising differences.
The PPO reflects the convergence and divergence of two moving averages. PPO is positive when the shorter moving average is above the longer moving average. The indicator moves further into positive territory as the shorter moving average distances itself from the longer moving average. This reflects strong upside momentum.
The PPO is negative when the shorter moving average is below the longer moving average. Negative readings grow when the shorter moving average distances itself from the longer moving average (goes further negative). This reflects strong downside momentum.
The histogram represents the difference between PPO and its EMA, the signal line. The histogram is positive when PPO is above its EMA and negative when PPO is below its EMA. The PPO-Histogram can be used to anticipate signal line crossovers in the PPO.
I am setting the PPO at 13,21,8.

Let’s See Why This Signal Could Offer Potential Trade Info
Each candle on the chart represents price movement over a 5-day (week) period. The last several weeks price has been mostly down. Next week’s candle will start with Monday’s price movement and then each consecutive day of the week will be added or subtracted to Monday’s number to create the weekly candle.
Options often offer a smaller overall investment, covering more shares of stock and potential for greater profits, as well as making money when the price of a stock drops.
Potential SPY trade:
I am typing this on Thursday. If price continues to fall you could consider a Put trade if it moves below 384.
Check Out How an Option Trade Could Pay Out Big Time
The stock price as of today (Saturday) is $385.13. However, it would be silly to buy shares of stock if you are expecting it to go down. You would wait until it found a bottom then buy.
If you were trading options and selected a 365-Put option strike, you would pay a premium of around $7.35 for the August 19th expiration, or $735 for the 100-share option contract. If price falls to 365, the premium is apt to go up about $5. Your premium of $735 plus $500 = $1235. That is a profit of 68% over a short period of time.
Remember, you can take profit anywhere along the line, you don’t have to wait for the expiration date to sell. It is often wise to take profit when it is earned, especially in a volatile market.
For updates on previous potential trades we have discussed, scroll to the bottom of this message.
I love teaching and sharing. It is my “thing”.
Stay positive and know you can do this. Knowing creates positive results! A part of the abundance process is letting go of anything negative, which creates space to receive.
I wish you the very best,
Wendy

Previous Trades:
Last week we discussed buying SPY 378 puts with an Aug 1st expiration date. On Friday 7-8 the premium was $5.02. As of today (7-14) you could sell for $9.56 which is a 90% profit.


Recent Comments