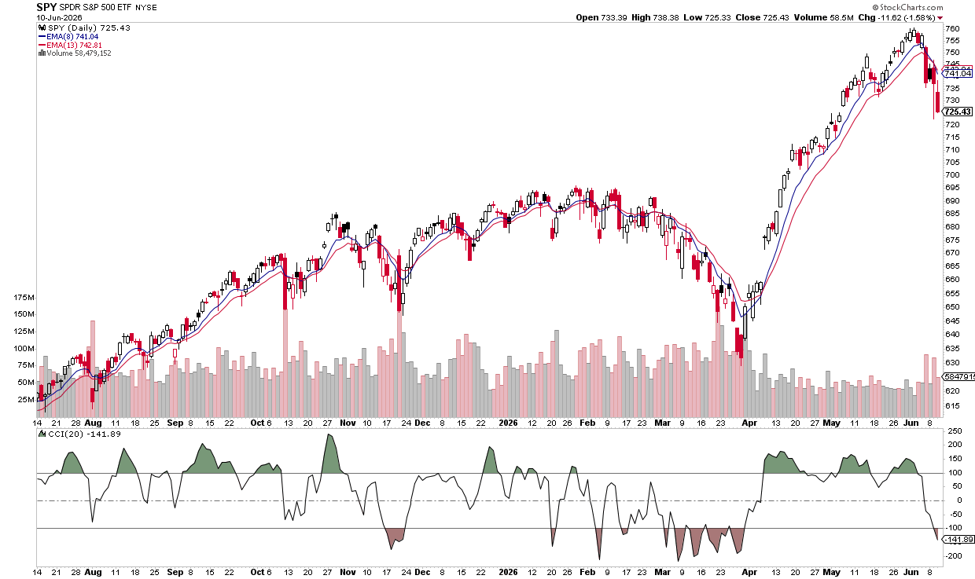
This chart is showing the first meaningful crack in the strong uptrend that has been in place since the April lows. After making a series of higher highs and higher lows, It experienced a sharp selloff that pushed price below both the 8-day and 13-day EMAs on heavy volume.
I watch the SPY chart every day, all day. I know that you may not have the time in your day to do that so I want to make sure you know about my SMART Paycheck program. I’ll do the work and send you the trades I find straight to your phone. The details are here.
On this SPY chart the Commodity Channel Index (CCI) has also plunged below the zero line and into negative territory, indicating a significant loss of short-term momentum. While the longer-term trend remains bullish, this sudden breakdown suggests traders should expect increased volatility and the possibility of additional downside or consolidation before buyers regain control. Key areas to watch are support near the recent breakout zone and whether SPY can quickly reclaim its short-term moving averages.
Please trade carefully, this is a unique environment.
Wishing you the best,
Wendy


Recent Comments