
Dear Reader,
Yesterday, we reviewed a recent winning call option purchase trade for Camden Property Trust.
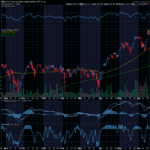
For today’s Trade of the Day we will be looking at an On Balance Volume chart for JPMorgan Chase & Co. (JPM). JPMorgan Chase & Co. operates as a financial services company worldwide. It operates through four segments: Consumer & Community Banking (CCB), Corporate & Investment Bank (CIB), Commercial Banking (CB), and Asset & Wealth Management (AWM).
Confirming a Price Uptrend with OBV
The JPM daily price chart below shows that JPM is in a price uptrend as the current price is above the price JPM traded at six months ago (circled). The On Balance Volume chart is below the daily chart.
On Balance Volume measures volume flow with a single Easy-to-Read Line. Volume flow precedes price movement and helps sustain the price uptrend. When a stock closes up, volume is added to the line. When a stock closes down, volume is subtracted from the line. A cumulative total of these additions and subtractions form the OBV line.
We can see from the OBV chart below that the On Balance Volume line for JPM is sloping up. An up-sloping line indicates that the volume is heavier on up days and buying pressure is exceeding selling pressure. Buying pressure must continue to exceed selling pressure in order to sustain a price uptrend. So, On Balance Volume is a simple indicator to use that confirms the price uptrend and its sustainability.

Confirmed ‘Buy’ Signal for JPM
Since JPM’s OBV line is sloping up, the most likely future price movement for JPM is up, making JPM a good candidate for a stock purchase or a call option spread.
Let’s use the Hughes Optioneering calculator to look at the potential returns for a JPM debit spread.
The analysis reveals that if JPM stock is flat or up at all at expiration the spread will realize a 60.8% return (circled).
And if JPM decreases 7.5% at option expiration, the option spread would make a 11.6% return (circled).
Due to option pricing characteristics, this option spread has a ‘built in’ 60.8% profit potential when the trade was identified*.
Option spread trades can result in a higher percentage of winning trades compared to a directional option trade if you can profit when the underlying stock/ETF is up, down or flat.
A higher percentage of winning trades can give you the discipline needed to become a successful trader.
The Hughes Optioneering Team is here to help you identify profit opportunities just like this one.

[Revealed] Chuck’s Most Effective Strategy
I’m holding a presentation this Monday to tell you all about it and show you exactly how it works.
Without spilling all of the beans before our live event on Monday, one of the big secrets behind this strategy is something we call “The Profit Lock” technique.
With “The Profit Lock” in place, most price swings don’t impact you. In fact you can still win the trade even if stock moves against you by as much as 10%!
Obviously, I cannot guarantee future profits or shield against losses…
But if you want to see the ins and outs of this system for the first time ever this Monday, you can do so right here.
Wishing You the Best in Investing Success,

Chuck Hughes
Editor, Trade of the Day
Have any questions? Email us at dailytrade@chuckstod.com
*Trading incurs risk and some people lose money trading.


Recent Comments