
This change can supercharge the effectiveness of one of the most widely used trading tools.
This week we are going to dive into the indicators I rely on to find, place, and manage trades to provide the greatest opportunity for profits.
Moving Averages are on almost every chart you look at, and for good reason. Trying to make decisions on a single data point is like trying to drive while only looking through a pinhole. Looking at a series of multiple data points can reveal repeating and potentially predictable patterns. That increased predictability is exactly what we are looking for when we search for our next trade.
To make moving averages even better, we can soup them up with a couple of additional elements. Exponential Moving Averages and Fibonacci patterns are a couple of my favorite ingredients for a good trade spotting recipe.
Fibonacci Exponential Moving Averages (EMA)
According to the definition at Stockcharts.com, exponential moving averages (EMAs) reduce the lag seen in simple moving averages by applying more weight to recent prices. The weighting applied to the most recent price depends on the number of periods in the moving average. We are applying 8, 21, and 55 weekly periods for our entry signals.
EMAs differ from simple moving averages in that a given day’s EMA calculation depends on the EMA calculations for all the days prior to that day. You need far more than 10 days of data to calculate a reasonably accurate 10-day EMA.
There are three steps to calculating an exponential moving average (EMA). First, calculate the simple moving average for the initial EMA value. An exponential moving average (EMA) must start somewhere, so a simple moving average is used as the previous period’s EMA in the first calculation. Second, calculate the weighting multiplier. Third, calculate the exponential moving average for each day between the initial EMA value and today, using the price, the multiplier, and the previous period’s EMA value.
Charting services or your broker’s chart service figure these calculations for you.
As mentioned, entry signals are based on the use of 8, 21, and 55 weekly averages. (8, 21 and 55 are Fibonacci numbers that are a special sequence of numbers that I prefer.) As mentioned, we are zeroing in on 8 EMA (short term), 21 EMA (medium term) and 55 EMA (long term).
EMA Buy Signal
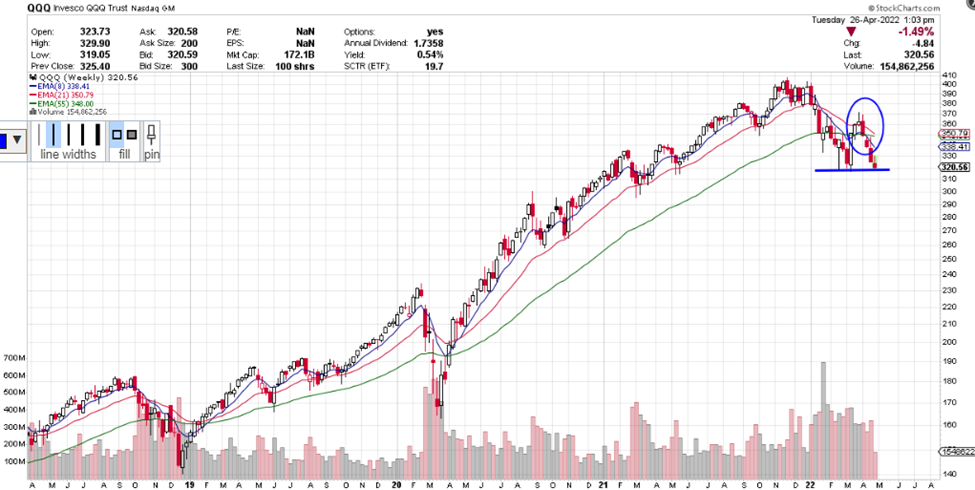
Each candle on the chart represents price movement over one week. The line indicators on the chart above and below the candles appear bearish. However, the candles may hit support at the line that I drew and move up. The 8 EMA line is below the 55 EMA, said to be in down trending order.
One of my favorite places to use Fibonacci Exponential Moving Averages is on the QQQ. You can get a sense of what it looks like on the chart above. QQQ has some unique characteristics like great liquidity and high volume that make the EMAs even more effective.
I go into even more detail on how this works and how you can take advantage of this predictability in my MERIT Paycheck program. You can click here to get more details.
Yours for a prosperous future,
Wendy Kirkland


Recent Comments