Happy Fabulous Friday!
I teach everyday people (like me) to trade options. I do my best to write in an understandable way as if we are talking over the kitchen table.
The market was down 3 out of 5 days last week. I am typing this on Wednesday, and you won’t get this until Friday. A lot can change in a couple days.
For today’s Trade of the Day, we will be looking at Micron Technology (MU). I have spotted a potential 250% grab and i have spelled it out below. Be sure to read down to see how it could come together.
Micron Technology, Inc. designs, manufactures, and sells memory and storage products worldwide. The company operates through four segments: Compute and Networking Business Unit, Mobile Business Unit, Storage Business Unit, and Embedded Business Unit. Micron Technology, Inc. was founded in 1978 and is headquartered in Boise, Idaho.
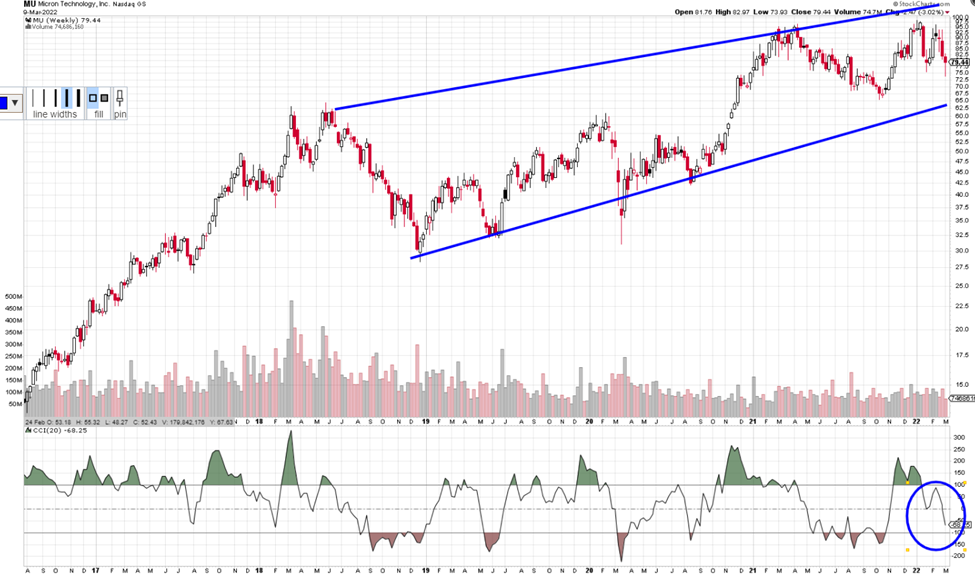
Let’s look at MU’s weekly chart.
The ADX -DI (red line) is above the +DI and the black ADX line is curling up. As long as the -DI is above the +DI, price should fall. Red above green is an indication of strength. If you want to learn more about ADX, read on or, if not, scroll down to the alert.

Average Direction Index (ADX) – Strength Indicator
The Average Directional Index consists of 3 lines: Green, Red and Black.
Green = +DI (Bullish)
Red = -DI (Bearish)
Black = ADX Strength Line
The DI line that is on top is in control. If the ADX line is heading up, strength is supporting the DI line that is on top and in control.
Each candle on the chart represents price movement over a 5-day (week) period; therefore, it takes weeks for trades to play out. On the chart, the week is a bullish candle as I type. When the -DI crosses over the +DI line, it gives a buy signal for Puts as the -DI line (red) appears as if it is in control and rising to head up on the ADX indicator, and as the ADX turns up that is even more bearish, suggesting a downward move is gaining strength. When the +DI (green line) crosses the red and the black line points up it shows an upward trend and Calls can be considered.
MU Potential Put Trade – Showing Strength
This signal could give a quick payout if it continues its downward move, and the strength of this pattern continues. I am typing this on Wednesday and MU costs about $79. If MU’s price moves below $78 and the – DI (red line) is above the +DI with the black line heading up you could consider a Put trade. The short-term price target for MU is $68 and then, perhaps, lower. With the swings in past months, I am suggesting small profit targets until a market trend starts again.
Option trading offers the potential of a lower initial investment and higher percentage gain. Let’s take a look and make a comparison.
It would be silly to buy a stock if you expect the price to go down. You would wait until it hit a bottom then buy.
If you bought 1 Put option covering 100 shares of MU with a April 14th expiration date for the 67.50 strike the premium would be approximately $2.00 today or $200 for 1 option. If price fell to $68 over the next few weeks, the premium would likely increase $5.00 giving $500 profit on your $200 investment, this is a 250% gain.
Trading options is a win, win, win opportunity. Options often offer a smaller overall investment, covering more shares of stock and potential for greater profits.
I like to stress when trading options, you don’t need to wait for the expiration date to close the trade. You can close anywhere along the way prior to the expiration date. It is never a bad idea to take profit.
Trading options is like renting stocks for a fixed period of time. The potential to generate steady income with options is real and it can be transforming. Watch this video to learn how you can use option trading to achieve financial freedom. click here
Yours for a prosperous future,
Wendy Kirkland

Past Equity Candidates:
Last week we looked at buying JPM March 25th 130 Puts. On 3/4 the premium was $3.85. On 3/9 you could have sold for $5.55 for a quick 44% gain.


Recent Comments