
It can be difficult to find the best new opportunity by just looking at the daily chart for a stock. That’s why I use indicators that highlight trends that are occurring “under the surface” to better pick my trades.
Today we are going to look at one of my favorite indicators along with my newest pick that it helped me spot! Then we will look at an option trade for the stock and see how options allow us to amplify potential returns while also providing downside protection for our trades.
For today’s Trade of the Day we will be looking at an On Balance Volume chart for Vertiv Holdings, LLC stock symbol: VRT.
Vertiv Holdings Co, together with its subsidiaries, designs, manufactures, and services critical digital infrastructure technologies and life cycle services for data centers, communication networks, and commercial and industrial environments in the Americas, the Asia Pacific, Europe, the Middle East, and Africa. It offers AC and DC power management products, switchgear and busbar products, thermal management products, integrated rack systems, modular solutions, and management systems for monitoring and controlling digital infrastructure.
Confirming a Price Uptrend with OBV
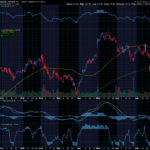
The VRT daily price chart below shows that VRT is in a price uptrend as the current price is above the price VRT traded at six months ago (circled). The On Balance Volume chart is below the daily chart.
On Balance Volume measures volume flow with a single Easy-to-Read Line. Volume flow precedes price movement and helps sustain the price uptrend. When a stock closes up, volume is added to the line. When a stock closes down, volume is subtracted from the line. A cumulative total of these additions and subtractions form the OBV line.
Volume flow precedes price and is the key to measuring the validity and sustainability of a price trend.
We can see from the OBV chart below that the On Balance Volume line for VRT is sloping up. An up-sloping line indicates that the volume is heavier on up days and buying pressure is exceeding selling pressure.

Confirmed ‘Buy’ Signal for VRT
Since VRT’s OBV line is sloping up, the most likely future price movement for VRT is up, making VRT a good candidate for a stock purchase or a call option spread.
Let’s use the Hughes Optioneering calculator to look at the potential returns for a VRT debit spread.

Built in Profit Potential
For this option spread, the calculator analysis below reveals the cost of the spread is $310 (circled). The maximum risk for an option spread is the cost of the spread.
The analysis reveals that if VRT stock is flat, up at all, or down at expiration the spread will realize a 61.3% return (circled).
Due to option pricing characteristics, this option spread has a ‘built in’ 61.3% profit potential when the trade was identified*.
The prices and returns represented below were calculated based on the current stock and option pricing for VRT on 2/26/2024 before commissions.

Option spread trades can result in a higher percentage of winning trades compared to a directional option trade if you can profit when the underlying stock/ETF is up, down or flat.
A higher percentage of winning trades can give you the discipline needed to become a successful trader.
The Hughes Optioneering Team is here to help you identify profit opportunities just like this one.
Unlock the Power of Precision with Chuck’s Wealth Creation Alliance!
Gain unlimited access to our cutting-edge Optioneering Calculators that revolutionize your approach to trading. Our expert Optioneering Team has meticulously crafted calculators for six distinct option strategies, empowering you to assess the profit potential of your trades. Click here to join me today and elevate your trading game with the precision of the Optioneering Calculators!
Wishing You the Best in Investing Success,

Chuck Hughes
Editor, Trade of the Day
Have any questions? Email us at dailytrade@chuckstod.com
*Trading incurs risk and some people lose money trading.


Recent Comments